Mark Latham Commodity Equity Intelligence Service

Friday 21 January 2022
Background Stories on www.commodityintelligence.com

News and Views:


Featured

US LNG 5x Russian Gas.

EU’s Imports Of U.S. LNG Five Times Higher Than Russian Supply

By Charles Kennedy - Jan 14, 2022, 9:00 AM CST

So far this month, the European Union has received U.S. natural gas volumes five times higher than Russia’s pipeline deliveries, according to Polish outlet rp.pl, the first time in history in which American LNG has surpassed Russian gas deliveries.  

Last month, at least 30 tankers with liquefied natural gas from the United States were headed to Europe, where the gas and energy crisis pushed regional LNG prices way above the Asian LNG benchmark and 14 times higher than the U.S. Henry Hub price.

At the same time, Russian gas deliveries have been lower than usual in recent weeks. Low Russian supply and cold weather have been the two main drivers of rising gas prices in Europe in recent weeks when Russia’s deliveries via Poland and Ukraine have been lower than historical norms.

Low natural gas deliveries from Russia appear to have artificially tightened the European gas market, the International Energy Agency’s Executive Director Fatih Birol said on Thursday, adding that energy systems “face significant risks” by relying too much on one supplier for a key energy source.

“We see strong elements of ‘artificial tightness’ in European gas markets, which appears to be due to the behaviour of Russia’s state-controlled gas supplier,” Birol wrote in a LinkedIn post.

Even with normal winter weather conditions, Europe faces storage inventories dropping to a record low of below 15 billion cubic meters (bcm) by the end of March, Wood Mackenzie said on Thursday.

“Without additional Russian imports, the ability to refill depleted storage and to avoid a repeat of last year’s crisis will be limited. But Gazprom has so far been reluctant to make more gas available on the existing routes. And the start-up of Nord Stream 2 remains the big unknown as Gazprom navigates regulatory approvals. Political relations remain fragile as Russian troops amass along the Ukrainian border,” said Kateryna Filippenko, principal analyst, European gas research, at WoodMac.   

https://oilprice.com/Latest-Energy-News/World-News/EUs-Imports-Of-US-LNG-Five-Times-Higher-Than-Russian-Supply.html

Back to Top

Emerging Energy: Parastatal Nightmare.

Oil & Gas Capability Statement Lucas Drilling Services (Lucas), a division of AJ Lucas Group, is one of few specialists able to deliver a life-of-programme service, all the way from Front End Engineering Design (FEED) to project execution and management. Its diverse talent pool allows the company to deliver optimal results for customers, and long-term relationships with the world’s largest operators means it is one of the most highly respected service providers in the industry.

Installation and cementing of liner casing can be a slow and laborious process, and for breakthrough boreholes the many interactions required with an underground mining team increases the complexity and potential for delay, risk, and further costs.

For one project, installation of a specialised stab-in cement shoe and/or a custom designed and manufactured external casing packer (ECP) in conjunction with newly developed 600mm (24”) threaded casing connections reduced overall project cost in excess of $500,000, improved project schedule by 12 days and reduced potential additional underground interaction delays by approximately 10 days.

For breakthrough boreholes, the ECP controlled formation water ingress into the mine and provided a safe cementing barrier without the need for underground mining team interaction, thereby eliminating worker risk and the need to manage water influx ahead of cementing the liner in place.

The use of large diameter threaded casing provided a fit for purpose liner, eliminating welding and associated inspection time whilst providing a significant reduction on borehole stability risk thanks to the speed of completion.

The project

A mining client required drilling and completion of five large diameter dewatering bores with a final lined diameter of DN600 (24”) over several locations with each borehole having variable geology ranging from soft paleo to significant bands of conglomerate. Two of the boreholes were to breakthrough into existing mine workings prior to final completion, however all sites were space constrained and required very efficient site logistics.

As part of the proposed solution, specialist provider to the energy, mining and infrastructure sectors AJ Lucas offered the client:

An engineered, specialised stab-in cement shoe

An engineered ECP with external control line, and

Threaded casing couplings newly developed in conjunction with a key supplier

The cement shoe was produced by a long-term Lucas supplier in conjunction with the Lucas drilling engineering team as part of the project pre-work design phase with the stab-in assembly designed to deliver cement via drill pipe, thus avoiding cement remnants inside the final 600mm casing liner and increasing the efficiency of cement pumping.

The ECP was produced by a specialist supplier in conjunction with the Lucas drilling engineering team to meet the expected borehole conditions whilst ensuring sufficient capacity to hold back the weight of the column of cement. Often, large diameter packers are inflated by manufacturer’s personnel to ensure correct packer setting is achieved, however Covid-19 state border closures prevented this from occurring. Technical support was provided remotely, and all packers were set successfully.

Conventional casing liner installation involves crane lifts and mechanical joint alignment ahead of welding each joint by a qualified welder, often with multiple passes, followed by inspection by a certified welding inspector. It is not uncommon for liner installation to take many days as the welding and inspection process occurs every 12 metres. Lucas installs approximately 200 service or dewatering bores greater than 311mm (12 ¼”) diameter per year for a range of clients and the opportunity to deploy the new threaded casing couplings was a step change for efficiency and borehole stability risk management.

Installation of the threaded liner casing with the stab-in cement shoe and/or ECP installed was carried out with a crane lift above the borehole centre whereby Lucas’s large casing tong aligned the connection then rotated the joint to shoulder up and torque the connection to the required specification, all in a single process. Consequently, 600mm (24”) liner casing installation was reduced to a couple of shifts.

External casing liner cementing was successfully carried out as a staged process to account for both supplier cement batching capacity and the limited site area. All boreholes were cemented successfully followed by installation of the surface pipework support assemblies.

The project borehole design called for a shallow 965mm (38”) conductor casing, installed in the range three to 12 metres, followed by 815mm (32”) surface casing to be installed to approximately 60m before the final 600mm (24”) liner casing was installed to target depth.

Due to the variable geology, a combination of air hammer and rotary mud drilling techniques were used. A strategy of pilot hole drilling, followed by hole opening passes provided valuable information to adapt drilling assemblies, or change drill bit design, with marked improvement observed as the project evolved.

The largest hammer used for the drilling was 640mm (25”) body diameter and used a 760mm (30”) bit. Up to eight compressors were required to run the hammer successfully and keep the borehole clean.

Essentially, the stab-in cement shoe, ECP and large diameter threaded casing represent a step change improvement to the drilling and effective completion of large diameter boreholes. Significant reductions in time, cost and risk were realised for the project without affecting the client’s underground operations.

https://www.mining-technology.com/sponsored/case-study-how-to-save-time-cost-and-mining-interaction-for-service-and-dewatering-bores/

Back to Top

Indonesia's Widodo's Press Office Correction.

Why Indonesia Is Jolting Markets by Curbing Commodity Exports

Barges transporting coal are moored on the Mahakam River in Samarinda, East Kalimantan, Indonesia, in October 2021. 

Barges transporting coal are moored on the Mahakam River in Samarinda, East Kalimantan, Indonesia, in October 2021. 

Photographer: Dimas Ardian/Bloomberg

Indonesia is the top exporter of coal for power stations and the biggest palm oil producer in the world. It also holds a quarter of all nickel reserves. So policy shifts in the Southeast Asian archipelago -- such as new restrictions on coal shipments or a proposed nickel export tax -- often reverberate across global commodities markets, roiling trading and pushing up prices for other countries that need the supplies. President Joko Widodo is nevertheless forging ahead with what’s known as resource nationalism, policies designed to get more benefit from the country’s natural riches for its 273 million people by restricting exports and encouraging more value-added processing at home. The going has been slow but there are signs the strategy is having an effect.

1. What’s in the spotlight now? 

Coal and nickel. 

  • A surge in global coal prices in 2021 prompted miners to shun the domestic market, despite rules that specify a quarter of output should be sold to local buyers. Shipments by sea of so-called thermal coal, used for power plants and other furnaces, surged to more than $246 a metric ton in October, according to China Coal Resource. That compares to a price cap of $70 a ton for sales by Indonesian producers to domestic power plants, which still rely mainly on coal. State-owned power company Perusahaan Listrik Negara was grappling with a dwindling stockpile, risking blackouts that could have affected millions of residents. So the government last year temporarily banned 34 exporters from shipping coal abroad, followed by a more drastic halt on all exports in January 2022. The Philippines and Japan were among the major importers to protest to Indonesia.
  • Meanwhile, to encourage investment in Indonesia, the government said in January it could impose a new export tax on nickel pig iron (a lower grade of pure nickel) and ferronickel (a semi-refined product) as soon as this year. The president, known as Jokowi, said in November that Indonesia could generate about $35 billion of added value by refining more nickel domestically rather than shipping raw material overseas for such things as stainless steel and electric vehicle batteries.
relates to Why Indonesia Is Jolting Markets by Curbing Commodity Exports
  

2. What’s the background?

Indonesia has a long history of being plundered, since the Dutch began collecting nutmeg and cloves from what they called the East Indies 400 years ago. Even in modern times, changing the dynamic hasn’t been easy. Indonesia banned metal ore exports in 2014 to encourage local smelter construction, arguing that too much wealth was shifting to refineries overseas and to foreigners. It later relaxed some of those rules partly in an effort to help producers cover the cost of constructing new refineries. A decision in 2019 to bring forward the date of curbs on sales of nickel ore overseas by two years -- to early 2020 -- sent global prices of the metal surging again, as consumers including China rushed to secure supplies. But after the initial jump, the market adapted quickly -- helped by those preparations and weaker demand due to the Covid-19 pandemic. 

3. What’s the ambition?

Jokowi, whose second and final term ends in 2024, has repeatedly said he wants to eventually stop exports of all raw commodities in favor of producing refined goods that would create more jobs and improve the nation’s trade position. Indonesia wants to be a global player in EV batteries and a regional player in the production of electric cars, with a target to be a supplier of key products like nickel sulfate, battery precursors and cathode materials by 2025. The government has said it will halt bauxite and copper ore shipments, with the ultimate goal of producing all EV components onshore. For coal, the target is to accelerate development of a coal-to-chemicals industry and to begin coal gasification projects that could offer an alternative to costly liquefied petroleum gas imports. 

Transportation of Coal in Indonesia
Tugboats guide barges transporting coal on Mahakam River in Samarinda in October.Photographer: Dimas Ardian/Bloomberg

4. Is it working?

Somewhat. Exports of higher-value nickel pig iron rose after the curbs on lower-cost nickel ore shipments, indicating some success. And investments in Indonesia are accelerating. Chinese nickel producers like Tsingshan Holding Group are adding projects, including in the key producing regions of Sulawesi and Maluku. From 19 mineral smelters now, a total of 53 are expected to be operating in 2023, including new plants for Vale SA’s local unit and Antam, the Indonesian state miner. The South Korea conglomerates Hyundai Motor Group and LG Energy Solution held a virtual groundbreaking in October on a $1.1 billion EV battery plant, with commercial production expected to start in 2024, according to the companies. Chinese giant Contemporary Amperex Technology Co. has expressed interest, while Foxconn Technology Group discussed investments with Indonesia’s government in October. In the coal sector, U.S.-based Air Products Inc. is partnering with state-owned PT Bukit Asam and PT Pertamina on a gasification project.

The Reference Shelf

https://www.washingtonpost.com/business/energy/why-indonesia-is-jolting-markets-by-curbing-commodity-exports/2022/01/18/b425c0ea-78cd-11ec-9dce-7313579de434_story.html

Back to Top

The Dream, or new highs on commodity indices.

SHANGHAI, Jan 18 (SMM) – Shanghai nonferrous metals mostly closed with gains amid rising commodity prices including crude oil. While the first press conference held by the People’s Bank of China in 2022 put forward the theme of “stability” with paramount importance.

Shanghai copper was flat, aluminium rose 1.77%, lead lost 0.77%, zinc gained 1.27%, tin advanced 1.36%, and nickel advanced 0.23%.

Copper: The most-traded SHFE 2203 copper closed up 0.01% or 10 yuan/mt at 70020 yuan/mt, with open interest up 1019 lots to 136183 lots.

On the macro front, the first press conference held by the People’s Bank of China (PBoC) in 2022 was quite productive. PBoC made it clear that it will maintain the steady growth of the total amount of money and credit, the steady optimisation of the credit structure, thesteady reduction in the comprehensive financing costs of enterprises, as well as the basic stability of the RMB exchange rate at a reasonable and balanced level. PBoC also indicated that RRR still has room of further adjustment, though limited.

In terms of oil, crude prices surged to seven-year high. OPEC believed that the oil market will gain sound support in 2022, which will offer some support to copper prices. Japanese Yen dropped on the central bank’s insistence on ultra-loose monetary policy. US dollar index rose 0.6% in late trading.

Tonight, the market shall watch the ZEW economy climate index in the eurozone in January.

Aluminium: The most-traded SHFE 2202 aluminium closed up 1.77% or 375 yuan/mt to 21530 yuan/mt, with open interest down 10718 lots to 129016 lots.

The fundamentals of aluminium have not changed much recently. The operating aluminium capacity in Yunnan and Shanxi rose slightly, and the total operating capacity was still low. The downstream consumption weakened approaching the Chinese New Year (CNY), resulting in rising inventory.

SMM expects that the aluminium inventory increase during the CNY will be less than in previous years, with an estimated high below 1.2 million mt.

Lead: The most-traded SHFE 2202 lead closed down 0.77% or 120 yuan/mt at 15510 yuan/mt, with open interest down 3951 lots to 18135 lots.

In spot market, secondary lead smelters were less willing to make shipments amid falling lead prices and high lead-acid battery scrap prices. The spot transactions were sluggish, coupled with tight supply. Primary lead was offered with discounts of 50-100 yuan/mt over SMM #1 lead. In the trading market in Zhejiang, the Tongguan, Jijin and Mulun lead was reported between 15,495-15,515 yuan/mt, or in discounts of 20-0 yuan/mt over SHFE 2202. The downstream purchased on dips. Some battery companies and small secondary lead smelters have already closed for CNY holiday.

Zinc: The most-traded SHFE 2202 zinc closed up 1.27% or 310 yuan/mt at 24780 yuan/mt, with open interest down 3688 lots to 48225 lots.

On the fundamentals, the spot prices rose along with rising SFHE zinc prices. The downstream demand was suppressed by high raw materials prices. On the other hand, some traders sold off, resulting in quickly falling intraday premiums. The spot prices in Shanghai were in premiums of around 90 yuan/mt over SFHE 2202 zinc.

Tin: The most-traded SHFE 2202 tin closed up 1.36% or 4270 yuan/mt at 318500 yuan/mt, with open interest down 5648 lots to 38655 lots.

On the fundamentals, the spot supply was stable, and the prices rose slightly. The warrants inventory dropped further. The supply and demand were still weak currently, and are expected to remain so in the short term.

Nickel: The most-traded SHFE 2202 nickel closed up 0.23% or 370 yuan/mt to 163760 yuan/mt, with open interest down 7110 lots to 125036 lots.

On the news front, a power plant was bombed amid political turbulence in Myanmar, while the nickel processing companies nearby were not severely affected, according to SMM research. However, the explosive indecent will definitely upset the market, boosting nickel prices. LME inventory also underpinned nickel prices.

https://news.metal.com/newscontent/101730763/SMM-Evening-Comments-Jan-18:-Shanghai-Nonferrous-Metals-Mostly-Closed-with-Gains-amid-Rising-Commodity-Prices/

Back to Top

A Quick Look at the top ten Lithium mines, their owners, and plans.

The new claims are accessible by way of a powerline infrastructure corridor mitigating the requirement for helicopter access only exploration activities.

David Thornley-Hall, CEO of Megawatt commented, "We are pleased to have acquired this substantial claims block in the James Bay area giving us the opportunity to explore two highly prospective zones in the region."

About MegaWatt Lithium and Battery Metals Corp.

MegaWatt is a British Columbia based company involved in the acquisition and exploration of mineral properties in Canada. The Company holds a 100% undivided interest, subject to a 1.5% NSR on all base, rare earth elements and precious metals, in the Cobalt Hill Property, consisting of eight mineral claims covering an area of approximately 1,727.43 hectares located in the Trail Creek Mining Division in the Province of British Columbia, Canada.

Additionally, the Company has acquired a 60% interest in a company that indirectly holds a 100% interest (subject to a 2% NSR) in two prospective silver-zinc projects in Australia, being the Tyr Silver Project and the Century South Silver-Zinc Project (see press release dated August 13, 2020) an indirect 100% interest (subject to a 1% NSR) in mining tenements in Northern Territory and New South Wales, Australia prospective for nickel-cobalt-scandium and rare earths and a 100% interest (subject to a 2% NSR) in and to the Route 381 Lithium Property, comprised of 40 mineral claims located in James Bay Territory, north of Matagami in the Province of Quebec, covering 2,126 hectares (see press release dated February 3, 2021).

Investors can learn more about the Company and team at https://megawattmetals.com.

The CSE does not accept responsibility for the adequacy or accuracy of this release.

This press release includes "forward-looking information" that is subject to a number of assumptions, risks and uncertainties, many of which are beyond the control of the Company. Forward-looking statements may include but are not limited to, statements relating to the trading of the Company's common shares on the Exchange and the Company's use of proceeds and are subject to all of the risks and uncertainties normally incident to such events. Investors are cautioned that any such statements are not guarantees of future events and that actual events or developments may differ materially from those projected in the forward- looking statements. Such forward-looking statements represent management's best judgment based on information currently available. No securities regulatory authority has either approved or disapproved of the contents of this news release.

SOURCE MegaWatt Lithium and Battery Metals Corp.

https://www.newswire.ca/news-releases/megawatt-acquires-additional-lithium-prospective-claims-877606832.html

Back to Top

Macro

South Korean president visits UAE, showcasing deep ties

After South Korean President Moon Jae-in met Emirati Prime Minister Sheikh Mohammed bin Rashid Al Maktoum in Dubai, the countries signed a memorandum of understanding for the UAE's purchase of a South Korean mid-range missile defense system valued at some $3.5 billion, South Korea's Yonhap news agency reported.

There were no further details on the deal announced during the visit nor immediate comment from the UAE. But during Dubai's weeklong aviation trade show last November, the Emirati Ministry of Defense tweeted it planned to acquire South Korea's M-SAM, an advanced air defense system designed to intercept missiles at altitudes below 40 kilometers (25 miles), saying it would “constitute a qualitative addition to the capabilities of the national air defense."

Sheikh Mohammed posted photos of the meeting and said the UAE seeks “a comprehensive strategic economic partnership” with South Korea, one of the world’s top crude importers and financiers of energy projects.

The nations have strengthened their defense cooperation over the past decade, with South Korean elite special forces even traveling to the UAE to train Emirati troops in an unprecedented years-long deployment for the Asian country.

Meanwhile, the UAE has hosted hundreds of North Korean laborers in past years who provide a key revenue stream for Pyongyang. But under pressure to enforce U.S.-led sanctions over North Korea’s nuclear program, Abu Dhabi has recently moved to choke off the network and stopped renewing North Korean work visas.

From Dubai’s Expo 2020, where South Korea boasts a sprawling pavilion to showcase the country’s high-tech and cultural achievements, President Moon praised the world's fair and pledged the countries will “transcend generations and national borders to build back together and leap forward together.”

President Moon landed in the regional financial hub of Dubai on Saturday, and was greeted by UAE Energy Minister Suhail al-Mazrouei. The oil and gas-dependent South Korea imports fossil fuels from the Persian Gulf, including from oil-rich Abu Dhabi, to power its energy-intensive economy, dominated by manufacturing industries from cars to petrochemicals.

The UAE represents 8% of Seoul’s oil imports, according to 2019 data from the U.S. Energy Information Administration.

Not only does Seoul buy Emirati oil, but South Korean firms have participated in the development of Emirati oil fields to boost the Asian country’s self sufficiency and, significantly, have built the UAE’s Barakah nuclear power plant — the first on the Arabian Peninsula.

The group of four reactors at Barakah in Abu Dhabi’s far western desert, which marked the Korea Electric Power Corporation’s first international deal, are gradually coming online. As the UAE seeks to decrease its reliance on fossil fuels and diversify away from oil, it plans to draw a quarter of its electricity from the $20 billion reactors.

During the South Korean trade minister’s trip to the UAE late last year, the countries also began negotiations on a new bilateral trade deal, including agreements to develop sources of clean power. On Monday, Moon met with an Emirati business delegation about clean-burning hydrogen fuel, his press office said.

The Abu Dhabi National Oil Company has sharpened its focus on hydrogen in recent months, building facilities to produce large volumes of the fuel and shipping so-called blue ammonia to Japan.

“Carbon neutrality is obviously a difficult process, but if the two nations promote the hydrogen industry through solidarity and cooperation, they will have new opportunities,” Yonhap news agency quoted Moon as telling a business forum in Dubai, adding that Seoul has helped the UAE develop a hydrogen-powered public transport system.

A different South Korean export takes center stage later Sunday at Expo, as star K-pop bands including Psy, of the hit song “Gangnam Style," will perform catchy songs and dynamic dance moves to frenetic fans that braved rare desert rain to line up since early morning.


https://www.swoknews.com/ap/business/south-korean-president-visits-uae-showcasing-deep-ties/article_05f49382-fd4c-5209-8259-97183587dfd4.html

Back to Top

China: 8.1% growth.

China's iron ore imports may reach 90 million tons in January, which would represent a 5 percent month-on-month increase, driven by stronger infrastructure investment, and Australia is likely to account for 60 percent of those imports, becoming the biggest beneficiary, industry insiders said on Sunday.
Domestic steel prices have gradually rebounded over the past two months, with the main contract for rebar futures up nearly 10 percent, driven by plans to increase infrastructure spending. That reflects rising steel demand in China and signals more iron ore imports.
While commodity prices generally reached low ebb at the end of the year, the market for iron ore was an outlier - prices bottomed out and started a slow rebound starting in November.
As of Thursday, the Platts iron ore price index was $128 per ton, an increase of $40.8 per ton or 46.8 percent from the low point in November 2021.
Industry analysts said that rising iron ore prices reflect an expected pick-up in China's infrastructure investment this year, especially as local government bond funds have become an important source of financing for infrastructure investment.
Recently, the Ministry of Finance announced a quota of 1.46 trillion yuan ($229.8 billion) for new special-purpose debts in 2022 in advance.
The early release of the new quota will allow "moderately advanced infrastructure investment" to obtain financial support, which will effectively play the role of infrastructure in underpinning the economy, according to the Beijing Lange Steel Information Research Center.
"The resumption of production in steel mills has driven the release of demand for raw materials… since December 2021... with the completion of production reduction work in many places, the trend of resumption of production in steel mills has emerged," Wang Guoqing, research director at the Beijing Lange Steel Information Research Center, told the Global Times on Sunday.
Other overlapping factors, including heavy rains in Brazil affecting Vale, one of the world's biggest iron ore miners, and the potential pandemic fallout in Western Australia on iron ore production, may also support iron ore prices, Wang said.
The steel price is about 4,600 yuan per ton on Sunday, and it may even hit a record high for winter storage, according to media reports.
While rising demand is expected to optimize iron ore imports in January, elevated prices won't last long, since the shipping and arrival volumes of imported iron ore remain fairly high, Wang said.
Expected production suspension amid the upcoming Winter Olympic Games will also curb demand. According to the Beijing Lange Steel Information Research Center, the implementation of staggered production measures to limit output by 30 percent in Beijing-Tianjin-Hebei and surrounding areas will be significantly strengthened.

https://www.globaltimes.cn/page/202201/1246105.shtml

Back to Top

Digitalisation and its impact on the mining industry

Free Whitepaper

Recent advances in underground mining technology Keep up-to-date with the latest trends in mining technology Australian underground mines are at the leading edge of performance. But it’s a fast-moving industry, and significant changes have taken place in recent years. The industry has invested heavily in the development and implementation of new mining technologies, with a focus on digitization and automation. This has led to significant improvements to mechanized underground mining productivity. This whitepaper focuses on the four key mechanised mining activities: jumbo development, long-hole drilling, LHDs, and decline trucking. It contains a detailed productivity and cost analysis plus descriptions of recent adaptations to mining systems and practices.

Miners have been using digital technology in virtually all aspects of their operations for decades, but some of the uses to which it is now being put sound as if they belong in the realms of science fiction.

For example, ‘Digital Twinning’ is now being configured and installed in many mines, by many companies. This concept is of a computer-generated virtual model that mimics a mine’s physical operations, allowing operators to review the status of equipment, from the largest dump trucks down to the throughputs of the smallest valves.

The physical and virtual ‘twin’ worlds are controlled by an artificial intelligence (AI) system that uses machine learning algorithms to monitor, record, and evaluate data provided by sensors contained in each piece of mining equipment. Adjustments based on the rules governing the AI’s base and ‘learned’ parameters can be made to any sensor-monitored piece of equipment, in real-time.

The value that Digital Twinning can bring to mining is difficult to quantify because every mine operation is unique. However, mine operators will certainly be able to use data from these monitored processes to analyse the improvements such systems make to the overall performance of the mine after they’re installed.

Augmented Reality

Augmented Reality (AR) allows for the same systems to be used for training, exploration, and physical monitoring purposes. From anywhere in the world, you can actually ‘visit’ a mine using AR viewing devices (goggles, glasses, etc) through which you can ‘see’ any of the mine’s functions you are interested in.

These smart AR devices can feed instructions directly to workers carrying out repairs on equipment, thereby improving operating disciplines and any other change required to systems by the data they collect. Work clothing with built-in sensors can transmit data to remote monitoring systems and supervisory personnel about environmental conditions, and indeed the physical condition of the workers themselves, thereby improving safety outcomes.

https://www.mining-technology.com/sponsored/digitalisation-and-its-impact-on-the-mining-industry/

Back to Top

Environmental Technology Market Is Likely to Experience a Tremendous Growth in Near Future

Global Environmental Technology Market Size study, by Component (Solutions, Services), by Application (Wastewater treatment, Water purification management, Sewage treatment, Pollution monitoring, Dust emissions, Dry steaming, Gas dissolution, Precision cooling, Solid waste treatment, Energy source for power generation and fuel and Others) by Technological Solutions (Waste valorization/ recycling & composting, Greentech/renewable energy,wind energy, photovoltaics, and geothermal energy, Desalination, Bioremediation, Green hydrogen, Carbon capture, utilization & storage and Others) by Vertical (Residential/municipal and Industrial transportation & logistics), and Regional Forecasts 2021-2027, The ‘ Environmental Technology market’ research report added by Report Ocean, is an in-depth analysis of the latest developments, market size, status, upcoming technologies, industry drivers, challenges, regulatory policies, with key company profiles and strategies of players. The research study provides market overview, Environmental Technology market definition, regional market opportunity, sales and revenue by region, manufacturing cost analysis, Industrial Chain, market effect factors analysis, Environmental Technology market size forecast, market data & Graphs and Statistics, Tables, Bar & Pie Charts, and many more for business intelligence.

Download Free Sample Copy of ‘Environmental Technology market’ Report @ https://reportocean.com/industry-verticals/sample-request?report_id=bw3295

Key Segments Studied in the Global Environmental Technology Market:

Global environmental technology market to reach USD $723.1 billion by 2027.

https://www.digitaljournal.com/pr/environmental-technology-market-is-likely-to-experience-a-tremendous-growth-in-near-future-abatement-technologies-veolia-waste-connections-total-s-a

Back to Top

CP Daily: Monday January 17, 2022 « Carbon Pulse

TOP STORY

Virginia Governor Glenn Youngkin (R) on Saturday issued an executive order to assess and ultimately sever the state’s RGGI-linked cap-and-trade regulation, though it is uncertain when or even if the new leader can end Old Dominion’s membership in the power sector carbon market without new legislation.

EMEA

EU member states should pursue emissions-cutting efforts in non-ETS sectors without resorting to flexibilities that may keep longer term targets out of reach, according to the lead parliamentarian for the bloc’s revised Effort-Sharing Regulation (ESR).

EUA prices fell in line with weaker gas and power markets on Monday amid forecasts for milder weather suggested gas supply is unlikely to be severely tested this winter, as demand for EUAs remained modest and trading activity was very limited.

ASIA PACIFIC

China’s domestic carbon price could rise 400% above current levels by 2030 and kick on from there as part of the country’s efforts to decarbonise by 2060, oil major Shell said in a report Monday.

The green energy arm of Australian iron ore mining giant Fortescue Metals Group, has added another green hydrogen deal to its list by signing a supply agreement with Covestro, a German chemicals company, FFI announced on Monday.

New Zealand carbon allowances hit a new record again on Monday, as the market continues to anticipate rising prices in the year ahead.

China’s thermal power generation rose 8.4% in 2021, government data showed Monday, with the nation’s Covid recovery causing a surge in carbon emissions.

INTERNATIONAL

UN Secretary General Antonio Guterres told the World Economic Forum (WEF) on Monday that there is no sign that governments are planning to effectively manage climate risks, urging the private sector to step up efforts and avoid greenwashing well ahead of November’s COP27 UN climate talks in Egypt.

Fund manager Carbon Cap’s World Carbon Fund closed 2021 with a 59% annual gain, as allowances prices in the five main cap-and-trade systems rose to an average of $60/tonne, the company said on Monday.

VOLUNTARY

Standardised nature-based voluntary emissions reductions (VER) prices found strength this week while technology-based CORSIA-eligible credits and others generally flatlined or sank.

https://carbon-pulse.com/148612/

Back to Top

A Transatlantic Rating of Biden’s First Year in Office

The new US President Joe Biden asserted he was committed to rebuilding America’s alliances after years of neglect and disdain. Europeans, frustrated by former President Donald Trump’s treatment of them, were anxious for a new beginning. Throughout the year, significant breakthroughs were made resolving bilateral trade disputes, launching technological cooperation, and coordinating relations with China.

But 2021 was also a year marked by Washington’s failure to consult Europeans before the mishandled pullout from Afghanistan, growing US preoccupation with China, and European worries about the uncertain reliability of American democracy.

As 2022 dawns, transatlantic relations have clearly entered a new era. There is a deepening appreciation that Europe and the United States face shared challenges best addressed together. The Russian troops massed on the Ukraine border as the new year begins are only one immediate example. At the same time, there is a realization that the United States may be a less reliable partner in the future and that Europe must finally take on more responsibilities on its side of the Atlantic and around the world.

This appraisal of transatlantic relations in 2021 grew out of the German Marshall Fund-Bundeskanzler Helmut Schmidt Stiftung 2020 Task Force report on transatlantic relations. This current assessment is based on over 50 interviews that Bruce, who is lead author, conducted with US and European foreign policy, security, and economics experts. The interviewees gave their time freely and their input is much appreciated. To ensure candor, all conversations were on a not-for-attribution basis. Nonetheless, the judgement of developments in transatlantic relations in 2021 is the sole responsibility of the authors.

Significant Achievements

“This first year of the Biden administration went about as positively as I hoped it would on the day of his inauguration,” said a former German ambassador to the United States. “When Biden said in February ‘we are back,’ there was some doubt that he could do that, but generally there is an appreciation that the United States is still a European power.”

“There were lofty expectations, especially among [American] Europhiles, that Europe would be more of a priority in overall Biden foreign policy,” concluded a foreign policy analyst at a Washington think tank. “There was this sense we would see a new day in the partnership and that the United States and Europe would start writing the rules of the road.”

Europeans are broadly delighted to see Biden as president," observed a former adviser on Europe in the Obama administration. "The glass is three-quarters or four-fifths full.

The 2021 transatlantic accomplishments were, indeed, significant. The longstanding Airbus-Boeing dispute over government aircraft subsidies was shelved. US tariffs on European steel and aluminum were lowered, averting a trade war. Europe and the United States spearheaded an international accord committing nations to a minimum global corporate tax rate. Some progress was made in addressing climate change. Brussels and Washington created a Trade and Technology Council to coordinate supply chains and technology policy. And a shared perception of China as a “strategic competitor” drove transatlantic convergence on dealing with Beijing.

“Europeans are broadly delighted to see Biden as president,” observed a former adviser on Europe in the Obama administration. “The glass is three-quarters or four-fifths full.”

Jarring Discontinuities

But transatlantic relations have also been battered by jarring discontinuities and troubling uncertainties that cast a cloud over 2022.

The US pullout from Afghanistan in August followed by the September announcement of the sale of US nuclear-powered submarines to Australia as part of a trilateral security pact (dubbed AUKUS because it also involved the United Kingdom), which supplanted an existing deal Paris had with Canberra, further undermined European trust in the United States.

“We were not surprised by the [Afghanistan] decision,” said a French security expert. “The departure was foreseeable.” But Europeans who had readily joined the US invasion of Afghanistan in 2001, as a gesture of allied solidarity, felt they had simply been informed by Washington, not consulted, about the withdrawal.

“You have to know that you have no other friends than Europe,” warned a Polish foreign policy expert. “If you screw up talking with us, that undermines the US system of alliances and that is not useful for the United States.”

And, added the head of a Brussels-based think tank, “AUKUS confirmed France’s longstanding fears of the United States. A lot of trust was lost and that is a very difficult thing to pull back.” Moreover, to many in Paris, the involvement of the United Kingdom only added insult to injury.

Compounding these two high-profile episodes was the European realization that China, not Europe, now preoccupies White House officials. “Anxiety, skepticism, and bad juju around the pivot to Asia is prevalent everywhere in Europe,” said a Berlin-based analyst. “The fear is that it will lead to transatlantic decoupling.”

But Europeans also acknowledge they share responsibility for lingering transatlantic discord. “I would have expected that Biden’s invitation to move beyond the Trump interlude and to team up would have been met by the European side with more enthusiasm,” observed a disappointed Green Party member of the European Parliament.

The Challenges that Lie Ahead

“America still acts as if it is the leader,” observed a disdainful Social Democrat member of the European Parliament. “But the preconditions for transatlantic leadership have changed fundamentally. America is not as sovereign as it used to be. America needs its allies as much as the allies need the United States.”

One of those allies is the new German government. American administrations have long relied on London to protect US interests on the continent. But, since Brexit, Washington has had to rely ever more on Berlin. In 2021, that meant a lame-duck Merkel government that was not enthusiastic about a tougher stance on China and did not want a new Cold War with Russia. “Most of the concessions that the Biden people have made—on tariffs, on minimum global tax rate, on Nord Stream 2—were all aimed at winning Germany over as a partner,” said a Berlin-based observer. “And, frankly, Berlin just pocketed all that.”

In 2022, with a new German government, there is an opportunity for greater cooperation. The new German Chancellor Olaf Scholz “considers Biden a like-minded leader,” said a Berlin foreign policy expert. “There is plenty of interest in working more with the United States on a whole range of issues.”

The Russian threat to invade Ukraine poses the most immediate test of transatlantic cooperation in 2022. How Europe and the United States respond—their ability to stay united in resisting Moscow’s demands for a sphere of influence in Eastern Europe and, if necessary, their steadfastness in maintaining joint economic sanctions against Russia that will prove more costly for Europe than for the United States—could be the most significant test of the security alliance since the Cold War.

No longer in Europe are they talking about who is the sick man in Europe," noted a worried New York-based foreign policy expert. "It’s America that is the sick man.

Going forward, there is also unprecedented European uncertainty about the trajectory of US democracy and what that means for transatlantic relations. The International Institute for Democracy and Electoral Assistance, based in Stockholm, has judged the United States a “backsliding democracy.” And a median of only 18% of the publics in nine European nations believes that US democracy is a good example for other countries to follow. “No longer in Europe are they talking about who is the sick man in Europe,” noted a worried New York-based foreign policy expert. “It’s America that is the sick man.”

The upcoming 2022 US Congressional elections and Biden’s fading public opinion poll numbers have Europeans quite worried.

“There is panic on what will happen in the United States,” said a Washington-based veteran of transatlantic relations. “Europeans hear that the Republicans may win the House and Senate in 2022 and the White House in 2024.”

“The Biden administration is working in a very narrow window of opportunity,” noted a US expert at a British think tank. “We may only have 10–11 months,” added a worried Social Democratic member of the European Parliament, “because after the midterm elections, things may be different.” And then the question will be, observed a former high-ranking EU official, “will Biden have any political capital to expend on things that are important for Europe?”

In February 2021, Biden told the Munich Security Conference that “America is back.” But in transatlantic relations, there is no return to the status quo ante. The domestic and international challenges facing both Europe and the United States have changed. The Trump experience, Afghanistan, and the US pivot to Asia have left Europeans wondering if they can count on the United States. Moreover, Washington’s slowness to move on lifting the steel tariffs, its inability to deliver more meaningful commitments on climate change, and the worsening partisanship of US domestic politics “has fed a conclusion in Europe that the relationship with the United States will never go back to 2016,” said a former US ambassador to NATO. “Domestic US politics will make it more difficult for the United States to lead in the traditional way, to provide public goods, even if Trump does not come back.”

“A fundamental trust has been broken,” he concluded. “The challenge is to find a new purpose for the relationship.”

The accomplishments, and the shortcomings, of the transatlantic relationship in 2021 provide a cautionary roadmap of what that new relationship can be in 2022 and beyond.

Trade Cooperation Promising

Cooperation on trade issues has been a very positive development in transatlantic relations in 2021, both symbolically and politically, even if it took some time to develop.

Burned by their frustrating efforts to negotiate the Transatlantic Trade and Investment Partnership during the Obama years and mindful of the Biden administration’s wariness of protectionist sentiment among its voting base, neither Brussels nor Washington has evidenced any interest in a bilateral trade agreement. Similarly, London’s entreaties for a UK-US free trade deal have fallen on deaf ears in Washington.

Nevertheless, important progress has been made on the trade front. At the beginning of Biden’s term, the transatlantic landscape was littered with both longstanding and more recent trade disputes. The two sides have been fighting over aircraft subsidies to Boeing and Airbus for 17 years, with the United States winning and exercising the right to retaliate in 2019 and the European Union getting the green light to strike back in October 2020. In June 2021, at the US-EU summit in Brussels, officials agreed on a five-year suspension of retaliatory tariffs in this dispute. And a working group was established to discuss subsidy limits in the face of prospective commercial aircraft competition from China. (They also agreed to establish the Trade and Technology Council, but that is covered in the next section of our review.)

Past victims of these tit-for-tat tariffs could not have been more pleased. “Ask a French wine exporter if he thinks Biden is no better than Trump,” said a senior French trade official, underscoring the importance of this agreement.

On the margins of the G20 Summit in October, Washington and Brussels agreed to end prohibitive tariffs imposed by the Trump administration on European shipments of steel and aluminum with a quota that will allow these European products to enter US markets duty-free. In return, the EU dropped retaliatory duties on high-profile US exports. Washington and Brussels also agreed to revive multilateral efforts to reduce global overcapacity in steel production, a three-decade-old ambition that is even more urgent today thanks to China’s massive production levels.

Although trade economists complained that the deal was “managed trade,” a former European business lobbyist praised the progress: “I am impressed by the pragmatism on both sides, especially with regard to steel and aluminum. Biden needed a deal to sell to his electorate and the European steel industry is suffering. It was a pragmatic solution that I did not expect at the beginning of the year.”

Biden needed a deal to sell to his electorate and the European steel industry is suffering. It was a pragmatic solution that I did not expect at the beginning of the year.

As a means of slowing global warming, the EU plans to impose a “carbon border adjustment mechanism,” a fee on CO2 emission-intensive imports, such as steel and cement. This tax is meant to ensure that European producers are not disadvantaged by Brussels’ efforts to curb such emissions, which will raise domestic production costs. With the United States unlikely to impose its own border tax, new transatlantic trade friction would be inevitable. To head this off, Washington and Brussels say they will develop a plan by 2024 to favor the imports of low-carbon steel and aluminum. In itself, commented a former high-ranking EU trade official, “this ‘green steel’ deal is not meaningful, it’s spinning something with very little content. But it could lead to sectoral carbon deals” that might help avoid an inevitable trade fight over how best to slow climate change.

In the G20, European governments and the United States spearheaded an agreement on a 15 percent minimum global corporate tax rate on the profits of large multinationals, while allocating a portion of those revenues to the countries to which those companies export. The agreement is aimed at minimizing decades-old tax competition between nations. If implemented, this minimum tax could provide a major curb on corporate tax avoidance using tax havens. It should also roll back the threat of digital services taxes that several European nations have imposed or plan to implement, which the US government has deemed unfair (but suspended retaliation pending multilateral solutions).

There has been one significant exception to closer transatlantic relations on trade: a lack of progress on reform of the World Trade Organization (WTO). The WTO is dysfunctional, both as a negotiating forum—where it has failed to produce major trade liberalization—and as a dispute settlement mechanism—because the United States, frustrated by decisions it disagreed with, has refused to assent to the appointment of members of the appellate body created to settle disputes. So far, the Biden administration has blocked resolution of this impasse due to “systematic concerns” about the dispute body overstepping its mandate.

Before Biden’s inauguration, incoming senior US officials vowed that WTO reform would be their top trade priority. The administration did end the standoff that had prevented the appointment of Ngozi Okonjo-Iweala as WTO Director-General. But other than that, one year into Biden’s term there is no tangible evidence of any US effort toward progress at the WTO.

“The United States is absent in Geneva,” complained a former senior WTO official, who ominously speculated: “Does the United States still need the WTO if it wants to weaponize trade against China? To do that, you need to get rid of the WTO.”

Developments in 2022 could well foreshadow the WTO’s fate. The United States, Europe, and Japan have revived their plurilateral talks on new subsidy disciplines, which they then want to multilateralize through the WTO. Success would help revive the Geneva-based institution. Failure, coupled with a continued stalemate on dispute settlement, may mean Europe and the United States will need other venues to develop new trade rules and resolve disputes.

https://www.gmfus.org/news/transatlantic-rating-bidens-first-year-office

Back to Top

CI Twitterati Watch - real interest rates

Back to Top

Dare to be a sceptic?

INTRODUCTION

This report provides a summary of the UK weather and climate through the calendar year 2020, alongside the historical context for a number of essential climate variables. This is the seventh in a series of annual ‘State of the UK climate’ publications and an update to the 2019 report (Kendon et al., 2020). It provides an accessible, authoritative and up-to-date assessment of UK climate trends, variations and extremes based on the most up to date observational datasets of climate quality.

The majority of this report is based on observations of temperature, precipitation, sunshine and wind speed from the UK land weather station network as managed by the Met Office and a number of key partners and co-operating volunteers. The observations are carefully managed such that they conform to current best practice observational standards as defined by the World Meteorological Organization (WMO). The observations also pass through a range of quality assurance procedures at the Met Office before application for climate monitoring. Time series of near-coast sea-surface temperature and sea-level are also presented and in addition a short section on phenology which provides dates of first leaf and bare tree indicators for four common shrub or tree species.

National and regional statistics in this report are from the HadUK-Grid dataset which is the principal source of data (Hollis et al., 2019). Temperature and rainfall series from this dataset extend back to 1884 and 1862, respectively. Details of the datasets used throughout this report and how the various series which are presented are derived are provided in the appendices.

https://rmets.onlinelibrary.wiley.com/doi/10.1002/joc.7285

Back to Top

Asian Markets Show Mixed Trend

(RTTNews) - Asian stock markets are trading mixed on Thursday, following broadly negative cues overnight from Wall Street, as traders pick up stocks at reduced levels following the recent sell-off and on a continued spike in crude oil prices. Traders also remain concerned about the raging spread of the coronavirus omicron variant across the globe and its impact on the pace of economic recovery from the pandemic. Asian markets closed mostly lower on Wednesday.

Concerns also remain amid rising Treasury yields and worries over inflation and looming interest rate hikes after U.S. Treasury yields hit fresh two-year highs on Fed rate hike expectations. Most analysts believe a rate hike of at least 25 basis points from the FOMC is imminent, although some are now starting to think it may be a 50 bps boost.

The Australian stock market is modestly lower in choppy trading on Thursday, extending the losses in the previous two sessions, with the benchmark S&P/ASX 200 just above the 7,300 level, following the broadly negative cues overnight from Wall Street, as traders are worried over inflation and looming interest rate hikes after U.S. Treasury yields hit fresh two-year highs amid Fed rate hike expectations.

Trades also remain concerned about the sharp spike in domestic new coronavirus infections, though off record highs. New South Wales records 30,825 new cases and 25 deaths on Wednesday. Victoria reported 21,966 new cases and 15 deaths, Queensland recorded 16,812 new cases and nine deaths, and ACT reported 892 new cases.

The benchmark S&P/ASX 200 Index is losing 16.50 points or 0.23 percent to 7,316.00, after hitting a low of 7,298.50 earlier. The broader All Ordinaries Index is down 13.40 points or 0.18 percent to 7,643.20. Australian markets ended significantly lower on Wednesday.

Among major miners, BHP Group is gaining almost 3 percent, OZ Minerals is up almost 2 percent and Mineral Resources is rising 3.5 percent, while Rio Tinto and Fortescue Metals are advancing 2.5 percent each. Oil stocks are mostly higher. Woodside Petroleum is edging up 0.2 percent and Origin Energy is gaining almost 2 percent, while Beach Energy is edging down 0.3 percent. Santos is flat.

Among the big four banks, Commonwealth Bank and National Australia Bank are losing 1.5 percent each, while ANZ Banking is edging down 0.3 percent and Westpac is down almost 1 percent.

In the tech space, Xero is losing more than 1 percent, Appen is slipping almost 2 percent, WiseTech Global is down more than 1 percent and Zip is declining more than 2 percent. Gold miners are all strongly higher as gold prices spiked overnight. Newcrest Mining and Resolute Mining are gaining more than 4 percent each, while Northern Star Resources is surging more than 8 percent, Evolution Mining is soaring more than 9 percent and Gold Road Resources is advancing more than 5 percent.

In economic news, the unemployment rate in Australia came in at a seasonally adjusted 4.2 percent in December, the Australian Bureau of Statistics said on Thursday - beating handily expectations for 4.5 percent and down from 4.6 percent in November. The participation rate was 66.1 percent - unchanged from the previous month but shy of expectations for 66.2 percent.

In the currency market, the Aussie dollar is trading at $0.723 on Thursday.

The Japanese stock market is slightly higher in choppy trading on Thursday, recouping some of the sharp losses in the previous two sessions, with the benchmark Nikkei 225 staying above the 27,500 level, despite the broadly negative cues overnight from Wall Street, as traders picked up stocks at a bargain after the recent selloff amid the raging spread of the coronavirus omicron variant in the country, with new daily cases breaching the 40,000 mark for the first time on Wednesday.

The benchmark Nikkei 225 Index closed the morning session at 27,594.29, down 127.06 points or 0.46 percent, after touching a high of 27,726.52 and a low of 27,217.59 earlier. Japanese shares ended sharply lower on Wednesday.

Market heavyweight SoftBank Group is edging down 0.3 percent, while Uniqlo operator Fast Retailing is edging up 0.3 percent. Among automakers, Toyota is adding more than 1 percent, while Honda is edging down 0.5 percent. In the tech space, Advantest and Tokyo Electron are losing almost 2 percent each, while Screen Holdings is declining almost 3 percent.

In the banking sector, Mitsubishi UFJ Financial is losing almost 1 percent and Sumitomo Mitsui Financial is edging down 0.3 percent, while Mizuho Financial is flat.

The major exporters are lower. Sony is gaining almost 4 percent and Canon is adding almost 1 percent, while Panasonic is losing more than 1 percent. Mitsubishi Electric is flat.

Among the other major gainers, Konami Holdings is gaining more than 5 percent, while Isetan Mitsukoshi and Ricoh are adding almost 4 percent each. Nexon, Itochu, Olympus and Unitika are advancing more than 3 percent each.

Conversely, Kawasaki Kisen Kaisha is plunging almost 10 percent and Mitsui O.S.K. Lines is sliding more than 9 percent, Nippon Yusen K.K. is losing almost 6 percent and T&D Holdings is down almost 4 percent, while Dai-ichi Life, Taiyo Yuden and Subaru are declining almost 3 percent each.

In economic news, Japan posted a merchandise trade deficit of 582.2 billion yen in December, the Ministry of Finance said on Thursday. That beat forecasts for a shortfall of 784.1 billion yen following the downwardly revised deficit of 955.6 billion yen in November (originally -954.8 billion yen). Exports climbed 17.5 percent on year, exceeding expectation for a gain of 16.0 percent following the 20.5 percent increase in the previous month. Imports were up 41.1 percent on year versus expectations for 42.8 percent and down from 43.8 percent a month earlier. For all of 2021, imports rose 24.3 percent and exports gained 21.5 percent for a trade deficit of 1.472 trillion yen.

In the currency market, the U.S. dollar is trading in the lower 114 yen-range on Thursday.

Elsewhere in Asia, New Zealand, China and Taiwan are lower by between 0.4 and 0.7 percent each. Hong Kong is surging 1.7 percent, while Singapore and Indonesia are up 0.1 and 0.3 percent, respectively. South Korea and Malaysia are relatively flat with a negative bias.

On Wall Street, stocks were unable to hold on to early gains on Wednesday, bouncing back and forth across the unchanged line before finishing in the red for the second straight session.

For the day, the Dow tumbled 339.82 points or 0.96 percent to finish at 35,028.65, while the NASDAQ dropped 166.64 points or 1.15 percent to close at 14,340.25 and the S&P 500 sank 44.35 points or 0.97 percent to end at 4.532.76.

Meanwhile, the major European markets moved higher on the day. The U.K.'s FTSE 100 Index added 0.35 percent, while the German DAX Index and the French CAC 40 Index rose by 0.24 percent and 0.55 percent, respectively.

Crude oil prices continued their recent upward surge on Wednesday, rising for the fifth straight day to a fresh seven-year high following supply issues in the Middle East. West Texas Intermediate for February contract jumped $1.22 or 1.43 percent to $86.65 per barrel.

https://www.nasdaq.com/articles/asian-markets-show-mixed-trend-5

Back to Top

Communiqué of the 6th Plenary Session of the 19th Central Commission for Discipline Inspection of the Communist Party of China

Communiqué of the 6th Plenary Session of the 19th Central Commission for Discipline Inspection of the Communist Party of China

(Adopted at the sixth plenary meeting of the 19th Central Commission for Discipline Inspection of the Communist Party of China on January 20, 2022)

The sixth plenary meeting of the 19th Central Commission for Discipline Inspection of the Communist Party of China will be held in Beijing from January 18 to 20, 2022. There were 125 members of the Central Commission for Discipline Inspection and 242 people attended the plenary meeting.

General Secretary of the CPC Central Committee, President of the State, and Chairman of the Central Military Commission Xi Jinping attended the plenary session and delivered an important speech. Party and state leaders including Li Keqiang, Li Zhanshu, Wang Yang, Wang Huning, Zhao Leji and Han Zheng attended the meeting.

The plenary session is chaired by the Standing Committee of the Central Commission for Discipline Inspection. Guided by Xi Jinping Thought on Socialism with Chinese Characteristics for a New Era, the plenary session fully implemented the spirit of the 19th National Congress of the Communist Party of China and the previous 19th plenary sessions, summarized the inspection and supervision work in 2021, deployed tasks for 2022, and reviewed and approved Comrade Zhao Leji on behalf of the Standing Committee of the Central Commission for Discipline Inspection The work report on "Using the Party's Hundred Years of Struggle History to Promote the High-quality Development of Discipline Inspection and Supervision to Welcome the Party's Twenty Victories".

The plenary session earnestly studied and deeply understood the important speech of General Secretary Xi Jinping. They agreed that the speech profoundly summed up the successful practice of the party's self-revolution in the new era, profoundly expounded the historic and pioneering achievements of comprehensively and strictly governing the party, and the all-round and deep-level influence it has produced. Make strategic arrangements to advance in depth and welcome the victory of the Party's 20th National Congress. The speech is lofty, profound and rich in connotation, which fully reflects the firm belief, selflessness and fearlessness of the CPC Central Committee with Comrade Xi Jinping at its core, the political courage to face up to the problem, to turn the blade inward, and the mission of not forgetting the original intention and moving forward bravely. , has a strong political, instructive, and pertinent nature, is the basic principle to promote the new great project of party building in the new era, and is an action guide for the high-quality development of discipline inspection and supervision work. General Secretary Xi Jinping placed high expectations on the team of discipline inspection and supervision cadres and put forward clear requirements. It is necessary to thoroughly study and implement General Secretary Xi Jinping's strategic thinking on the party's self-revolution, continuously improve political judgment, political comprehension, and political execution, and continue to fight the tough and protracted battle for the construction of party conduct and clean government and the fight against corruption, in order to maintain stability and health. The economic environment of the country, the social environment of Guotai and the people's security, and the political environment with a clean air will make due contributions.

The plenary session pointed out that 2021 is a landmark year in the history of the party and the country. The Party Central Committee with Comrade Xi Jinping at its core united and led the whole Party and the people of all ethnic groups in the country to solemnly celebrate the centenary of the founding of the Communist Party of China, successfully convened the Sixth Plenary Session of the 19th Central Committee of the Party, formulated the Party's third historical resolution, and comprehensively summarized the Party's The major achievements and historical experience of the century-old struggle, carry out the study and education of the party history, win the battle against poverty as scheduled, build a moderately prosperous society in an all-round way, realize the goal of the first century of struggle, and start building a modern socialist country in an all-round way, and march toward the goal of the second century of struggle. In the new journey, the party and the country have made new major achievements in various undertakings, and the "14th Five-Year Plan" has achieved a good start. Under the strong leadership of the CPC Central Committee, the Central Commission for Discipline Inspection, the State Supervision Commission and the discipline inspection and supervision organs at all levels have thoroughly studied and comprehended Xi Jinping Thought on Socialism with Chinese Characteristics for a New Era, deeply understood the decisive significance of the "two establishments", and consciously assumed the major political responsibility of the "two maintenances". Responsibility, deeply grasp the responsibilities and tasks of discipline inspection and supervision in promoting the party's self-revolution, seek progress in stability, be firm and steady, seek truth from facts, keep upright and innovative, maintain comprehensive and strict governance of the party, sober and firm on the road forever, maintain upright conduct and discipline, The strategic determination of anti-corruption and punishing evil, focusing on the overall situation of modernization, has played a role in supervising and guaranteeing implementation and promoting perfect development, and new achievements have been made in the high-quality development of discipline inspection and supervision. In-depth study of the spirit of the Sixth Plenary Session of the 19th Central Committee of the Communist Party of China and the important exposition of General Secretary Xi Jinping on the history of the party, and the important speech at the celebration of the 100th anniversary of the founding of the Communist Party of China, enhance historical confidence, practice fighting skills, and be firm, comprehensive and strict. Party political consciousness. Closely focus on the "14th Five-Year Plan" and strengthen political supervision, strengthen the daily supervision of the "top leaders" and leading groups, and correct the political deviations in the implementation of the Party Central Committee's policies and work arrangements. Resolutely investigate and deal with major corruption cases, seriously investigate and deal with corruption cases intertwined with political and economic problems, increase anti-corruption efforts in the fields of state-owned enterprises, finance, politics and law, grain purchase and sales, development zone construction, etc., and implement cases to promote reform and governance. We will constantly promote the implementation of the spirit of the eight central regulations, deepen the rectification of formalism, bureaucracy, hedonism and extravagance, and strengthen the supervision of the disciplinary atmosphere of the change of office. Continue to deepen political inspections and give full play to the comprehensive supervision role of inspections and inspections. Adhere to regulations, disciplines and laws, deepen the use of the "four forms", and implement accountability in a precise and standardized manner. Focusing on consolidating and expanding the achievements of poverty alleviation and effectively connecting rural revitalization, we will carry out special supervision during the transition period, deepen the special governance of corruption and work style issues in the field of people's livelihood, solidly promote the "I do practical things for the people" practice activity, and resolutely punish corruption and "protective umbrellas" involving gangsterism and evil. . Deepen the reform of the discipline inspection and supervision system, strengthen the legal The construction of regulations and systems, strictly supervise and restrain the power to enforce discipline and law enforcement, and resolutely prevent "darkness under the lights". The plenary session summed up the understanding and experience formed in the practice of the past year. While affirming the achievements, it also analyzed the problems existing in the discipline inspection and supervision work and the construction of the cadre team in a realistic manner, requiring great attention and practical solutions.

Back to Top

Oil

Russian Oil Output Struggles.

Russia Seen Struggling to Keep Pace With OPEC+ Supply Hikes

  • Country may only manage about half of scheduled oil increases
  • Higher drilling seen delivering additional supply after 2022

Russia may be able to deliver only about half of its scheduled increases in crude production over the next six months, joining the ranks of OPEC+ nations that are struggling to ramp up even as fuel demand rebounds from the pandemic. 

With crude already trading above $85 a barrel in London, the outlook for Russian output leaves the global market looking even tighter than expected. It risks amplifying the energy-price surge that’s contributing to the highest inflation in decades. 

In the booming Asian physical market, Russian premium ESPO crude -- a favorite grade among Chinese processors -- has already surged to the highest since November amid declining inventories in China, according to traders.

The OPEC+ member is supposed to be adding 100,000 barrels a day of crude to the market each month, but growth ground to a halt in December. Due to a decline in drilling last year, most analysts polled by Bloomberg News expect Russia’s actual monthly increases can go no higher than 60,000 barrels a day in the first half of 2022. 

“We have a hard time seeing Russian suppliers maintaining 100,000 barrels-a-day production increases each month for the next six months,” Bank of America Corp. analysts Karen Kostanyan and Ekaterina Smyk told Bloomberg.

Baby Steps

Most analysts expect a modest growth in Russia's crude-only output

NOTE: Renaissance Capital's estimate includes condensate production

The Organization of Petroleum Exporting Countries and its allies are in the process of restoring output halted during the pandemic. The coalition is supposed to pump an additional 400,000 barrels a day each month, yet the actual production increases have fallen short due to factors ranging from internal unrest to insufficient long-term investment in a number of countries.

Last month, OPEC boosted output by just 90,000 barrels a day. Russia’s production started stagnating in November, and in December it dropped below its OPEC+ quota for crude, according to Bloomberg estimates based on Energy Ministry statistics. The first days of January brought a less than 1% rise in the country’s total petroleum output, which includes crude and a light oil called condensate that is extracted from natural gas, according to Interfax.

Russia’s top oil official, Deputy Prime Minister Alexander Novak, has said the country will continue to hit its production targets. Output of crude will rise to 10.1 million barrels a day this month, he told the Tass news agency last week. That would be in line with its OPEC+ quota and an increase of about 100,000 barrels a day from December. 

Inflationary Pressure

If OPEC+ continues to struggle to hit its production targets, there may be wider economic consequences. The recovery in oil demand has remained robust as the Omicron strain of the coronavirus has a milder effect on the global economy than anticipated. 

Brent crude, the international benchmark, has jumped more than 10% since the start of the year and may have further to go, according to Vitol Group. High energy prices are a significant contributor to rising inflation and the White House has consistently applied pressure on OPEC+ to boost supply and help curb fuel costs. 

Losing Steam

Russia's output has stabilized recently amid lack of spare capacity

Source: Bloomberg calculations based on the Enery Ministry's CDU-TEK monthly data

Through most of 2021, Russia maintained fairly consistent monthly production increases as it restored capacity idled in the early stages of the Covid-19 pandemic. By November, the revival started to run out of steam. 

The spread of active, idle and shut-down Russian production wells returned to pre-pandemic levels, indicating that the industry had nearly fully deployed its spare capacity. That was later confirmed by statements from the country’s largest producers, Rosneft PJSC, Lukoil PJSC and Gazprom Neft PJSC.


Back on Track

Number of Russia's operating wells has returned to pre-Covid level

Source: Energy Ministry's CDU-TEK unit

Last year, Russian oil majors were in no hurry to boost their production drilling, a move that would have enabled new capacity to be brought onstream in late 2021 and in 2022. By the end of November, overall drilling rates for the year were down 4.5% compared to the same period in 2020, according to Interfax data based on the Energy Ministry’s CDU-TEK figures. 

The Russian oil industry has been in wait-and-see mode due to the uncertainty around the effect of the coronavirus on demand, according to analysts from Bank of America and Vygon Consulting. Several companies also capped production last year after some of their projects lost tax breaks. 

These producers “are rather unwilling to invest” in those projects until they find out whether the Finance Ministry will bring some of those incentives back, said Daria Melnik, a senior analyst at Oslo-based consultant Rystad Energy A/S. The government is ready to consider some tax breaks from 2023 at the earliest, provided that the OPEC+ output cuts end this year as planned, Deputy Finance Minister Alexey Sazanov told Bloomberg last month.

Digging and Rigging

Russian oil companies cut 2021 production drilling on market uncertainties

Sources: Trofimuk Institute of Petroleum Geology and Geophysics, Slavneft-Megionneftegaz, Interfax report based on Energy Ministry's CDU-TEK data

This year, most major Russian producers plan to increase capital expenditure, varying from a boost of around 10% at Gazprom Neft to some 20% at Rosneft. Tatneft PJSC expects its 2022 upstream investments to grow as much as three to four times compared with last year. 

This increase in drilling will eventually deliver higher output, but most of the gains will come after 2022. The new wells will generate only a modest increase this year, according to analysts from Rystad Energy to Renaissance Capital. 

Rosneft, which accounts for a significant part of total spending in the Russian oil industry, “is now channeling money into its Vostok Oil project, it’s the producer’s main priority,” said Melnik. The company plans to start large-scale crude production at the Arctic project in 2024.

Gazprom Neft’s Zima cluster of new fields in Western Siberia, which analysts from Renaissance Capital and Rystad Energy name as a source of new crude for the producer in 2022, will reach peak output in 2024. Its Arctic oil-rims project is already producing, but will ramp up gradually, doubling over five years. 

This explains why most observers see Russia falling short of its targets in 2021. “We don’t expect Russia to raise its output by 100,000 barrels per day on any month this year,” said Melnik.

https://www.bloomberg.com/news/articles/2022-01-18/russia-seen-struggling-to-keep-pace-with-opec-oil-supply-hikes

Back to Top

China is shredding US influence in the Middle East – Community News

Last week saw a series of meetings in Beijing between senior officials of the Chinese government and foreign ministers of Saudi Arabia, Kuwait, Oman, Bahrain and the Secretary General of the Gulf Cooperation Council (GCC). During these meetings, the main topics of discussion were to finally seal a free trade agreement between China and the GCC and “deeper strategic cooperation in a region where US dominance is showing signs of withdrawal”. according to local news reports.

As OilPrice.com has emphasized for some time, US influence in the Middle East in particular has declined since Donald Trump’s presidency, consistent with his remarks to “get out of endless wars” and that the US no longer resolve ‘old conflicts in distant lands’. The repercussions of this broad policy idea found the greatest resonance in those countries that were already affiliated with the US’s main global rivals for power – China and Russia. These notably include Iran, Iraq, other states in the Shia shekel of power, and Syria, a shift analyzed in depth in my new book on global oil markets. Following the unilateral US withdrawal from the Joint Comprehensive Plan of Action in May 2018 and the subsequent broad and deep alliance between Iran and China, as described in its 25-Year Comprehensive Strategic Agreement, it was Iran’s historical enemy, Saudi Arabia, who felt particularly vulnerable to a seemingly revived Tehran, and looked to the US for reassurance.

The problem at the time was that a series of events in previous years de core relationship between Saudi Arabia and the US that was formulated and formalized at a meeting on February 14, 1945, between then-US President Franklin D. Roosevelt and then-Saudi King Abdulaziz. This agreement meant that the US would receive all the oil supplies it needed as long as Saudi Arabia had oil in place, in exchange for which the US would guarantee the security of both the ruling House of Saud and, by extension, Saudi Arabia. Arabia. However, faced with the prospect of having its own oil industry — the only substantial revenue generator it has — marginalized by the then-nascent U.S. shale oil sector, Saudi Arabia launched the 2014-2016 oil price war to try to destroy the U.S. shale threat, or on least seriously. When that effort didn’t have the desired effect – only succeeding in destroy Saudi Arabia’s own finances and those of its oil-producing neighbors too – the US modified the 1945 agreement in one major way. The new understanding was: The US will guarantee the security of both Saudi Arabia and the ruling House of Saud as long as Saudi Arabia guarantees that the US will get all the oil it needs as long as Saudi Arabia has oil in its possession. place and that Saudi Arabia is not trying to interfere with the growth and prosperity of the US shale oil sector. Shortly afterwards (in May 2017), the US assured the Saudis that it would protect them from any Iranian attacks, on the condition that Riyadh also buy a massive amount of weapons from Washington – $110 billion immediately and $350 billion over the next 10 years. However, the Saudis found that none of these weapons could prevent Iran’s launch successful attacks against its main oil facilities in September 2019, or several subsequent attacks.

At about the same time that US guarantees of security to Saudi Arabia proved to be of limited value, Riyadh also tried to raise funds to close the huge financial gaps caused by the 2014-2016 oil price war. an initial public offering (IPO) for its oil and gas giant, Saudi Aramco. The additional problem in this regard for Saudi Arabia was that when the oil price rose to or above the level at which it could make a profit (US$84 per barrel of Brent was the budgetary break-even price for a few years after the end of 2014-2016 oil price war), the US Told It And Its OPEC Brothers To Pump More because it hurt the US economic prospects. In particular, before the last decoupling between oil and gas prices, the long-standing rule of thumb was that for everyone: one cent that the average price of gasoline in the US rose, more than US$1 billion a year in discretionary additional consumer spending was lost. The US – and every other western country – refused to allow Aramco to do any part of its listing on their respective benchmark exchanges for a wide range of reasons, limiting Saudi’s ability to start rebuilding its own finances, but China was ready, willing and able to provide a solution to the Aramco IPO problem.

China’s willingness to do so — and more importantly from the personal perspective of Crown Prince Mohammed bin Salman (MbS) to allow him to save face in the IPO — was another key milestone in Saudi Arabia’s shift to China. . The solution was that China would simply buy the entire stake – at that time 5 percent was the indicated amount – in a direct private placement. This would have two huge benefits for MbS: first, raising the money Saudi Arabia needed immediately, and second, no public disclosure of the bid price per share is needed. The latter factor would allow MbS to reassure senior Saudis, who by then were skeptical of his abilities to lead the country when the time came, that he had managed to secure the $2 trillion worth of all of Aramco. which he had publicly announced. as a measure of IPO success.

Although the offer was ultimately turned down, the fact that China had offered itself as a safety net for MbS’s most important public project to date was not forgotten, nor were China’s ensuing desires to forge closer ties with Saudi Arabia. to forget. Shortly after the offer was made, China was called by the then deputy minister of economy and planning of Saudi Arabia, Mohammed al-Tuwaijri, as: “By far one of the top markets” to diversify Saudi Arabia’s financing base and that: “We will also be able to access other technical markets in terms of unique financing options, private placements, panda bonds and others.” These comments came around the same time as the visit of high-ranking politicians and financiers of China to Saudi Arabia in August 2017, with a meeting between King Salman and the Chinese Deputy Prime Minister, Zhang Gaoli, in Jeddah, and during the visit, Saudi Arabia said seriously for the first time that it was willing to consider financing itself partially in Chinese yuan, eliminating the possibility of closer financial ties between the two countries. At these meetings, according to comments made by then-Saudi Energy Minister Khalid al-Falih, it was also decided that Saudi Arabia and China would establish a US$20 billion 50:50 investment fund that would invest in sectors such as infrastructure. , energy, mining and materials, among others. The August 2017 Jeddah rallies followed a historic visit to China by King Salman of Saudi Arabia in March of that year, during which approximately $65 billion in business deals were signed in sectors such as oil refining, petrochemicals, light manufacturing and electronics.

Of Russia has already positioned itself as essential to the effectiveness of any future OPEC policies and deals in the wake of the 2014-2016 oil price war, China through its ‘One Belt, One Road’ (OBOR) program – with all the associated investments – was and remains ideal positioned to pick up influence across the region as the US retreats. Moreover, for the oil-producing countries of the Middle East, China does not threaten their position in the global oil sector, as the US is through its shale oil sector, but rather remains a notable end consumer. The fact that China’s OBOR-related investments come with significant caveats that allow Beijing to secure key strategic tracts of land or sea in lieu of debt or investments made – including Iran’s key airports and naval ports under the 25-year contract with china, Hambantota Port in Sri Lanka, and The Port of Doraleh in Djibouti – can be viewed by these Middle Eastern states as little different from the terms attached to American investment since the end of World War II. For the US however, news just before Christmas that Saudi Arabia are now active own ballistic missiles with help from China, should not be viewed as part of any reasonable rebalancing of power in the Middle East, especially in light of Washington’s current and ongoing efforts to address Iran’s nuclear ambitions.

https://community99.com/china-is-shredding-us-influence-in-the-middle-east/

Back to Top

Oil Breaks Higher.

Back to Top

China admits importing Iran Oil.


China Discloses Iranian Oil Imports as Nuclear Talks Drag On

(Bloomberg) -- China disclosed its first Iranian oil imports in a year amid talks between between Tehran and world powers aimed at reviving a nuclear accord that could pave the way for lifting U.S. sanctions.

Is Covid Becoming Endemic? What Would That Mean?

A total of 260,312 tons, or 1.9 million barrels, arrived in December, according to customs data on Thursday. That’s the first time the Chinese central government has reported any purchases from the fifth-largest producer in the Organization of the Petroleum Exporting Countries since December 2020.

The disclosure comes at a delicate time, with an eighth round of multilateral nuclear talks under way in Vienna and, separately, China looking to beef up its economic ties with Tehran. At a meeting last week, the top diplomats from Iran and China pledged to begin implementing a 25-year-long agreement between the two nations that will unlock billions of dollars in trade.

Diplomats say that China may tip outcome of the nuclear talks, which also involve France, Germany and the U.K. Beijing’s deepening cooperation with Tehran in the face of U.S. sanctions may have given the Islamic Republic’s government an economic escape route.

“China is testing the waters as the U.S. is presently focused on Russia and the Ukraine,” said John Driscoll, chief strategist at JTD Energy Services Pte in Singapore. “Certainly, Iranians might be one of the most motivated sellers out there, so it will be a natural alliance.”

U.S. President Joe Biden said on Wednesday “it’s not time to give up” on reviving the accord with Iran as progress had been made. If the sanctions are eased, the Persian Gulf country may raise exports, weighing on crude prices.

https://finance.yahoo.com/news/china-discloses-iranian-oil-imports-072142404.html

Back to Top

Oil: No Stories.


Back to Top

Oil and Gas

Orphan Well Action Announced


Mitch Landrieu announces $4.7 billion plan to clean up orphaned oil and gas wells

Federal agencies have reached an understanding, which will kick off a $4.7 billion campaign to clean-up orphaned oil and gas wells that were abandoned years ago by the energy industry, former New Orleans Mayor Mitch Landrieu, who now is the president’s infrastructure czar, said during a White House press conference Tuesday.

“Millions of us, millions, live within a mile of hundreds of thousands of orphan wells that leak and spew. These wells jeopardize public health and safety by contaminating ground water, seeping toxic chemicals, emitting harmful pollutants including methane,” Landrieu told reporters. “Cleaning it up will take an all-government approach.”

He was named Infrastructure Implementation Coordinator by President Joe Biden to handle the roll-out of the $1.2 trillion Infrastructure Investment and Jobs Act that is spending more than has been spent in a generation to fix and upgrade roads, bridges, airports and other pieces of the nation’s long neglected infrastructure.

Home to 4,605 orphan oil and gas wells, Louisiana seeks federal money to plug them


The law includes $4.7 billion to cleanup orphan well sites, plugging remediation and restoration activities. But the first step was to work out a “memorandum of understanding” between the federal Departments of the Interior, Agriculture, and Energy, the Environmental Protection Agency, and the Interstate Oil and Gas Compact Commission that would detail how the work that would be done and identify which agency responsible for what tasks.

https://www.wvgazettemail.com/news/legislative_session/supreme-court-requests-5-budget-hike-dep-seeks-support-to-hire-gas-oil-well-inspectors/article_165b5add-4f91-57d6-a0b6-d67e8aad92fd.html

Back to Top

Sinopec sells 45 LNG cargos.

A top Chinese liquefied natural gas (LNG) importer is offering to sell dozens of spot cargoes this year, indicating the world’s biggest buyer is well-stocked.

The trading arm of Sinopec issued a sales tender offering up to 45 cargoes for delivery between February and October to ports in North Asia, according to traders with knowledge of the matter. This is the first time the oil major — traditionally a buyer — has issued such a large sales tender, the traders added.

The surprise move will likely spur bearish sentiment in the LNG spot market, which has slumped over the last few weeks as Asian importers curbed purchases on the back of high inventories. With the end of the peak winter demand season within sight, traders are betting that the region will avoid a crippling supply crunch.

https://www.bloomberg.com/news/articles/2022-01-19/china-s-sinopec-floods-lng-spot-market-with-cargoes-for-2022

Back to Top

Saudi Studies the Shale.

Back to Top

Japan Oil Imports Contract.

TOKYO, Jan 20 (Reuters) - Japan's imports of liquefied natural gas (LNG) fell 0.2% in 2021 to 74.32 million tonnes, giving up the world's largest buyer spot to China which increased its imports of the super-chilled fuel by 18% to a record high.

Japan's imports of the fuel dropped for a fourth straight year to the lowest since 2010, the year before the March 2011 Fukushima nuclear disaster which sent gas purchases soaring as reactors were shut down, preliminary data released by the finance ministry showed.

China's imports of LNG for the whole last year totalled a record 78.93 million tonnes, according to the customs data. read more

Japan's imports of crude oil fell for a ninth straight year in 2021 to the lowest in more than 50 years amid a shrinking, aging population that consumes less fuel because of more efficient vehicles and a turn to gasoline-electric hybrids.

Back to Top

Uranium

Consensus Indicates Potential 92.1% Upside

Uranium Energy Corp. with ticker code (UEC) now have 5 analysts covering the stock with the consensus suggesting a rating of ‘Buy’. The range between the high target price and low target price is between 7 and 5.5 with a mean TP of 6.3. With the stocks previous close at 3.28 this is indicating there is a potential upside of 92.1%. The 50 day MA is 3.96 and the 200 moving average now moves to 3.15. The market cap for the company is $887m. Company Website: https://www.uraniumenergy.com

The potential market cap would be $1,704m based on the market consensus.

You can now share this on Stocktwits, just click the logo below and add the ticker in the text to be seen.

Uranium Energy Corp., together with its subsidiaries, engages in exploration, pre-extraction, extraction, and processing uranium and titanium concentrates in the United States, Canada, and Paraguay. It owns interests in the Palangana mine, Goliad, Burke Hollow, Longhorn, and Salvo projects located in Texas; Anderson, Workman Creek, and Los Cuatros projects situated in Arizona; Slick Rock project in Colorado; Reno Creek project in Wyoming; Diabase project located in Canada; and Yuty, Oviedo, and Alto Paraná titanium projects in Paraguay. The company was formerly known as Carlin Gold Inc. and changed its name to Uranium Energy Corp. in January 2005. Uranium Energy Corp. was incorporated in 2003 and is based in Corpus Christi, Texas.

https://www.directorstalkinterviews.com/uranium-energy-corp.---consensus-indicates-potential-92.1-upside/4121043923

Back to Top

A Nuclear Discussion.

TSX.V: CVV
www.canalaska.com

Mr. Peter Dasler reports:

  • Terra Uranium has Staged Option to Earn up to 80% Interest in McTavish and Waterbury East Projects, subject to Resource definition
  • Focus on High-Grade Eastern Athabasca Uranium Discovery

Vancouver, British Columbia--(Newsfile Corp. - January 19, 2022) - CanAlaska Uranium Ltd. (TSXV: CVV) (OTCQB: CVVUF) (FSE: DH7N) ("CanAlaska" or the "Company") is pleased to announce it has entered into Purchase Option Agreements ("POA") with Terra Uranium Limited ("Terra"), an Australian public limited corporation, and Terra's wholly-owned Canadian subsidiary Terra Uranium Canada Limited, to allow Terra to earn up to an 80% interest in CanAlaska's 100%-owned Waterbury East and McTavish projects. These projects total 4,202.21 hectares in the Eastern Athabasca Basin in Saskatchewan, Canada (the "Projects") (Figure 1).

Waterbury East and McTavish Projects

Terra may earn up to an 80% interest in each of the Waterbury East and McTavish projects by undertaking work, milestone payments to CanAlaska and resource definition in three defined earn-in stages on each project as set out below:

  • Terra may earn an initial 40% interest ("40% Option") in each of the projects by paying the Company AUD$37,500 cash per project and issuing 9% worth of ordinary shares in Terra's capital structure as at listing on the Australian Securities Exchange ("ASX") by March 31, 2022 per project.
  • Terra may earn an additional 20% interest ("60% Option") in each of the projects by paying a further AUD$200,000 per project and incurring AUD$2,500,000 in exploration expenditures within 18 months of the ASX listing date per project.
  • Terra may earn an additional 20% interest ("80% Option") in the projects by delivering and filing a JORC compliant resource of at least 30,000,000 pounds U3O8 on any of the Waterbury East or McTavish claims, and granting to the Company a 2.25% net smelter returns (NSR) royalty on all products derived from any of the claims, within 36 months of the ASX listing date.

CanAlaska will be Operator of the projects through the 60% Option threshold and charge an operator fee to Terra.

The POA envisages conversion to a Joint Venture. Under the terms of the POA, after successful completion of either of the 40% Option or 60% Option stages of the agreement, and where Terra elects to not enter the next respective option stage as applicable, or on successful completion of the 80% Option stage, a joint venture will be formed and the parties will co-contribute on a simple pro-rata basis or dilute on a pre-defined straight-line dilution formula. If either party dilutes to a 10% interest, the diluting party will automatically forfeit its interest in the respective project and in lieu thereof will be granted a 2.0% net smelter returns (NSR) royalty on the respective project. If the 80% Option NSR of 2.25% had been previously granted to CanAlaska, CanAlaska would not be entitled to this 2.0% NSR provision on dilution to 10% interest.

An area of mutual interest has been established that extends two kilometres from the boundary of the claims.

Under the terms of the POA, if the Conditions Precedent are not met or if Terra elects to terminate prior to exercise of the 40% Option, a break fee of AUD$12,500 per project is due to CanAlaska.

First Programs

The parties have established a Joint Technical Operating Committee ("JTOC") under the terms of the POA to discuss exploration and development strategies, review and comment on programs and budgets submitted by the Operator, review the progress and results of activities conducted under the current programs and to discuss other issues in respect to the properties. The final binding decision with respect to establishing Programs to be carried out by the Operator (including any changes or amendments to Programs) shall be made by Terra Uranium. The preliminary work programs and budgets for each project have been laid out for the next 2 years. Once the 40% Option threshold has been met, it is anticipated the first exploration programs under the POA with Terra will be conducted in early 2022.

About Terra Uranium Ltd and Terra Uranium Canada Limited

Terra Uranium Ltd is an Australian public limited corporation that is in the process of undergoing an initial public offering and concurrent listing on the Australian Securities Exchange ("ASX"). The POA agreements are subject to a number of Conditions Precedent, including that Terra has received conditional approval from the ASX to be listed on the ASX and raising sufficient funds to carry out the programs

Terra Uranium Canada Limited is a wholly-owned Canadian subsidiary of Terra Uranium Ltd, incorporated in Saskatchewan, Canada.

CanAlaska CEO, Cory Belyk, comments, "Completion of the definitive agreements with Terra Uranium represents significant funding for exploration on the highly prospective Waterbury East and McTavish projects in the Eastern Athabasca Basin, without dilution of CanAlaska shareholders interest in our core properties. We look forward to working closely with Terra and its management team toward a common goal of tier 1 uranium deposit discovery."

Other News

The Company has just commenced drilling on its 100% owned Waterbury South project and is currently undertaking a detailed Stepwise Moving Loop Time Domain Electromagnetic (TDEM) Survey on its West McArthur project, in advance of the planned summer drill program.

About CanAlaska Uranium

CanAlaska Uranium Ltd. (TSXV: CVV) (OTCQB: CVVUF) (FSE: DH7N) holds interests in approximately 300,000 hectares (750,000 acres), in Canada's Athabasca Basin - the "Saudi Arabia of Uranium." CanAlaska's strategic holdings have attracted major international mining companies. CanAlaska is currently working with Cameco and Denison at two of the Company's properties in the Eastern Athabasca Basin. CanAlaska is a project generator positioned for discovery success in the world's richest uranium district. The Company also holds properties prospective for nickel, copper, gold and diamonds. For further information visit www.canalaska.com.

The qualified technical person for this news release is Nathan Bridge, MSc., P.Geo., CanAlaska's Vice President, Exploration.

On behalf of the Board of Directors
"Peter Dasler"
Peter Dasler, M.Sc., P.Geo.
President
CanAlaska Uranium Ltd. 

Contacts:

Cory Belyk, Executive VP and CEO
Tel: +1.604.688.3211 x 306
Email: cbelyk@canalaska.com

Peter Dasler, President
Tel: +1.604.688.3211 x 138
Email: info@canalaska.com 

https://www.juniorminingnetwork.com/junior-miner-news/press-releases/895-tsx-venture/cvv/114265-canalaska-partner-to-spend-aud-5m-for-60-of-two-uranium-projects-in-the-athabasca-basin.html

Back to Top

Crypto

CI Twitterati Watch - Jurrien Timmer of Fidelity


Back to Top

Precious Metals

Equity Drills Shallow, High-Grade Gold-Silver, Including 0.4 Metres of 9.0g/t Au, 3,574g/t Ag, 12.7% Cu, 1.2% Pb and 5.5% Zn (5,692g/t AgEq), on the Eastern Portion of the Camp Vein Target, Silver Que

Vancouver, British Columbia--(Newsfile Corp. - January 18, 2022) - Equity Metals Corporation (TSXV: EQTY) ("Equity") reports High-grade Gold-Silver drill intercepts from a previously unmodelled hangingwall zone on the eastern end of the Camp Vein Target at the Silver Queen project, B.C.

Highlight intervals Include:

  • In drill hole SQ21-047: a 0.4 metre interval grading 9.0g/t Au, 3,574g/t Ag, 12.7% Cu, 1.2% Pb and 5.5% Zn (5,692g/t AgEq) within a 3.2 metre interval averaging 1.8g/t Au, 679g/t Ag, 2.4% Cu, 0.2% Pb and 2.2% Zn (1,131g/t AgEq);
  • In drill hole SQ21-048: a 1.6 metre interval grading 2.9g/t Au, 4,032g/t Ag, 11.4% Cu, 0.5% Pb and 6.8% Zn (5,597g/t AgEq) within a 3.0 metre interval averaging 1.8g/t Au, 2091g/t Ag, 5.9% Cu, 0.4% Pb and 3.9% Zn (2,941g/t AgEq); and
  • In drill hole SQ21-048: a 0.8 metre interval grading 3.3g/t Au, 632g/t Ag, 3.3% Cu, 0.4% Pb and 2.6% Zn (1,299g/t AgEq) within a 2.8 metre interval averaging 1.0g/t Au, 192g/t Ag, 1.0% Cu, 0.4% Pb and 1.1% Zn (416g/t AgEq).

The intercepts correlate with the No. 5 Vein, which historically was identified in surface sampling and limited shallow drilling to the east of the holes reported here. The target remains open to the east where it transitions into the larger Sveinson Vein Target, which includes the historic No 5 and other veins. The current intercepts are relatively shallow (<100 metres depth) and undrilled to depth.

Additional assay results from drill holes SQ21-042 to -046 and the extension of drill hole SQ21-018 returned multiple mineralized intercepts which continue to establish continuity of the four modelled veins on the eastern extension of the main Camp Vein target. Highlights include:

  • In drill hole SQ21-046: a 1.3 metre interval averaging 0.6g/t Au, 416g/t Ag, 1.9% Cu, 0.6% Pb and 14.1% Zn (1,196g/t AgEq), and
  • In drill hole SQ21-045: a 0.3 metre interval grading 1.2g/t Au, 1,434g/t Ag, 2.6% Cu, 0.3% Pb and 0.2% Zn (1,789g/t AgEq).

All assay results have now been received from the Phase IV drilling on the Camp Vein Target, which was completed in early Autumn 2021. A further 13 drill holes were drilled in November/December 2021 as part of Phase V drilling on the Sveinson Vein target which includes the historic No. 5 and other veins that have been only partially tested (see Figure 1). Assays are pending and anticipated over the next several weeks.

Crews have now mobilized to recommence drilling on the property, focusing initially on the NG-3 target. Detailed drilling, including the intercepts reported here, will be utilized in developing the Company's maiden resource for the Camp Vein target, expected in Q2 of 2022.

VP Exploration Rob Macdonald commented, "The identification of strongly enriched gold and copper, in addition to bonanza-grade silver, in multiple drill holes in these most recent assay results adds a significant new element to the exploration and development story evolving at the Silver Queen project. Recent drilling has continued to test extensions of the Camp Vein target farther to the east and into the Sveinson Vein Target, a cumulative strike length of over 1,250 metres. Assays from the Sveinson Vein target are pending and anticipated in the coming weeks. New drilling, starting this week, will test farther east into the NG-3 Vein target, which has seen only modest historical drilling."


Figure 1: Plan Map of targets on the Silver Queen vein system, BC

To view an enhanced version of Figure 1, please visit:
https://orders.newsfilecorp.com/files/5566/110556_19b230a1f40ce8d9_002full.jpg


Figure 2: Plan Map of the Camp Vein Target showing recent drill results

To view an enhanced version of Figure 2, please visit:
https://orders.newsfilecorp.com/files/5566/110556_19b230a1f40ce8d9_003full.jpg

President Joe Kizis commented, "Equity Metals has now completed a total of 63 drill holes for 19,645 metres in five successive phases of exploration drilling starting in late 2020 on the Silver Queen property, testing five separate target areas. Thick intervals of high-grade gold, silver and base-metal mineralization have been returned from drilling at the Camp, Sveinson Extension, No. 3, and NG-3 Vein systems, demonstrating the target-rich nature of the Silver Queen property."

Table 1: Summary Composites from September2021 Drilling on the Camp Vein Target

Hole #
From
(m)

To
(m)

Interval (m)
Au
(g/t)

Ag
(g/t)

Cu
(%)

Pb
(%)

Zn
(%)

AuEq
(g/t)

AgEq
(g/t)

Comments


SQ21-042
29.7
30.5
0.9
0.4
99
0.1
1.2
5.0
4.9
364


inc.
30.0
30.5
0.5
0.6
147
0.1
2.1
7.5
7.4
553


SQ21-042
54.9
56.3
1.4
0.2
320
0.1
0.1
2.8
6.1
456


SQ21-042
122.4
123.2
0.8
0.1
582
0.2
0.2
0.4
8.4
632


SQ21-043
34.6
35.0
0.4
0.1
155
0.1
0.5
6.1
5.6
421


SQ21-044
62.4
63.1
0.8
0.4
96
0.2
0.3
2.8
3.5
259


SQ21-044
92.3
92.9
0.6
0.4
187
0.7
0.1
1.6
4.6
344


SQ21-045
78.5
79.2
0.8
0.2
163
0.1
0.1
2.2
3.7
278


SQ21-045
182.9
183.1
0.3
1.2
1434
2.6
0.3
0.2
23.8
1789


SQ21-046
208.9
210.2
1.3
0.6
416
1.9
0.6
14.1
15.9
1196


inc.
208.9
209.5
0.6
0.8
596
3.6
1.1
13.0
20.3
1521


SQ21-046
220.0
220.4
0.4
0.0
37
0.1
1.7
3.2
3.0
223


SQ21-046
224.2
226.8
2.7
0.1
231
0.2
0.1
2.2
4.5
339


inc.
226.4
226.8
0.5
0.3
1192
0.9
0.2
3.7
19.3
1451


SQ20-018 (EXT)
197.6
199.2
1.5
0.3
30
0.0
0.6
1.1
1.5
111


SQ20-018 (EXT)
274.4
274.7
0.3
1.5
261
1.4
0.8
4.1
9.1
680


SQ21-047
43.7
46.8
3.2
1.8
679
2.4
0.2
2.2
15.1
1131


inc.
44.5
46.8
2.3
2.4
918
3.3
0.3
2.7
20.3
1520


inc.
44.7
45.2
0.4
9.0
3574
12.7
1.2
5.5
75.9
5692


SQ21-047
69.2
70.5
1.3
0.4
88
0.3
0.7
3.1
3.8
287


inc.
70.1
70.5
0.4
1.0
97
0.1
1.9
9.8
8.3
624


SQ21-047
190.8
191.1
0.3
1.3
90
0.5
2.6
4.4
6.5
489


SQ21-048
48.8
51.8
3.0
1.8
2091
5.9
0.4
3.9
39.2
2941
36.7% dilution
inc.
50.3
51.8
1.6
2.9
4032
11.4
0.5
6.8
74.6
5597


SQ21-048
127.2
130.0
2.8
1.0
192
1.0
0.4
1.1
5.5
416


inc.
128.0
128.8
0.8
3.3
632
3.2
0.4
2.6
17.3
1299


SQ21-048
184.7
190.6
5.9
0.1
61
0.1
0.2
1.3
1.8
135
40% dilution
inc.
184.7
186.0
1.3
0.1
178
0.1
0.6
1.9
3.8
286


Samples were analyzed by FA/AAS for gold and 48 element ICP-MS by MS Analytical, Langley, BC. Silver (>100ppm), copper, lead and zinc (>1%) overlimits assayed by ore grade ICP-ES analysis, High silver overlimits (>1000g/t Ag) and gold overlimits (>10g/t Au) re-assayed with FA-Grav. Silver >10,000g/t re-assayed by concentrate analysis, where a FA-Grav analysis is performed in triplicate and a weighed average reported. Composites calculated using a 80g/t AgEq (1g/t AuEq) cut-off and <20% internal dilution, except where noted. Reported intervals are core lengths, true widths undetermined or estimated. Accuracy of results is tested through the systematic inclusion of QA/QC standards, blanks and duplicates into the sample stream. AuEq and AgEq were calculated using prices of $1,500/oz Au, $20/oz Ag, $2.75/lb Cu, $1.00/lb Pb and $1.10/lb Zn. AuEq and AgEq calculations did not account for relative metallurgical recoveries of the metals.

About Silver Queen Project

The Silver Queen Project is a premier gold-silver property with over 100 years of historic exploration and development and is located adjacent to power, roads and rail with significant mining infrastructure that was developed under previous operators Bradina JV (Bralorne Mines) and Houston Metals Corp. (a Hunt Brothers company). The property contains an historic decline into the No. 3 Vein, camp infrastructure, and a maintained Tailings Facility.

The Silver Queen Property consists of 45 mineral claims, 17 crown grants, and two surface crown grants totalling 18,852ha with no underlying royalties. Mineralization is hosted by a series of epithermal veins distributed over a 6 sq km area. Most of the existing resource is hosted by the No. 3 Vein, which is traced by drilling for approximately 1.2km and to the southeast transitions into the NG-3 Vein close to the buried Itsit copper-molybdenum porphyry.

An initial NI43-101 Mineral Resource Estimate (see Note 1 below) was detailed in a News Release issued on July 16th, 2019, and using a CDN$100 NSR cut-off, reported a resource of:

  • Indicated - 244,000ozs AuEq: 85,000ozs Au, 5.2Mozs Ag, 5Mlbs Cu, 17Mlbs Pb and 114Mlbs Zn; and
  • Inferred - 193,000ozs AuEq: 64,000ozs Au, 4.7Mozs Ag, 5Mlbs Cu, 16Mlbs Pb and 92Mlbs Zn.

More than 20 different veins have been identified on the property, forming an extensive network of zoned Cretaceous- to Tertiary-age epithermal veins. The property remains largely under explored.

https://finance.yahoo.com/news/equity-drills-shallow-high-grade-143000394.html

Back to Top

Drilling at Del Norte Indicates 7.01 m grading 37.50 g/t Au eq. in Hole #12 and 10.98m grading 18.61 g/t Au eq. in Hole #15

January 18, 2022 – TheNewswire - Vancouver, Canada –– Teuton Resources Corp. (“Teuton” or “the Company”) (TSXV:TUO) (OTC:TEUTF) (Frankfurt:TFE) has received the remaining assays for the last 8 drill holes from the 2021 program on the Company’s Del Norte property, located 34 km east of Stewart in BC’s “Golden Triangle”.

Drilling tested the contact of felsic volcanic rocks of the Hazelton Group and sedimentary rocks of the Salmon River Formation, the same horizon that hosts the Eskay Creek mine 60km north of Stewart. Drilling was from platforms located on rock islands (nunataks) sited within the South Nelson Glacier. The 2021 drilling was successful in testing for extensions of 2020 gold-silver drill hole intersections on the Argo/LG zone.

Highlights of drilling into the Argo zone include:

60.5 g/t gold and 660 g/t silver over 3.60m in DDH-21-12

11.7 g/t gold and 3,074 g/t silver over 2.29m in DDH-21-15

Decade Resources reports that the Del Norte property contains numerous mineralized zones. The two most important mineralization events are associated with quartz veins and breccias which are spatially restricted to felsic packages and the footwall contact of thrust zones as well as porphyry copper-gold. In the area of thrusting, quartz veins and breccia include the Argo/LG Vein/LG Extension Zone, Kosciuszko Zone/ SP, Eagle’s Nest, and New. The Argo/LG Vein/LG Extension Zone has been traced over 1.2km while the New zone was observed over 100m of strike in a high mountain pass between 2 ice fields. The Kosciuszko/SPzone has been traced over 1.2km as well while the Eagle’s Nest zone has been traced over 400m.These are marked by a distinct alteration halo, with a propylitic zone constituting the outer envelope of the mineralization. Galena, sphalerite, pyrite and minor chalcopyrite and tetrahedrite are common in these quartz veins.

Decade currently holds the property under option from Teuton Resources. It can earn a 55% interest in the Del Norte by spending $4 milllion in exploration over a five year period, Decade must also pay $400,000 in cash to Teuton, issue 800,000 shares upon signing (paid) and issue a further $180,000 worth of shares thereafter. After earning its 55% interest, Decade has a further option to expand its interest to 75% by taking the property to feasibility.

https://www.thenewswire.com/press-releases/1kEjFxNdl-drilling-at-del-norte-indicates-701-m-grading-3750-g-t-au-eq-in-hole-12-and-1098m-grading-1861-g-t-au-eq-in-hole-15.html

Back to Top

Alianza Minerals Recaps 2021 Results and Outlines 2022 Plans

Vancouver, BC – TheNewswire - January 18, 2022 - Alianza Minerals Ltd. (“Alianza”) (TSXV:ANZ) (OTCQB:TARSF) provides a summary of 2021 accomplishments and a preview of 2022.

“We had an extremely productive year in 2021, marked by advancement of the exciting new West Fault high grade silver target at our Haldane Project in Yukon’s historic Keno Hill Mining District,” stated Jason Weber, P.Geo, President and CEO of Alianza. “We also made great progress introducing our Copper Alliance in the Southwest United States, making two acquisitions, and farming out one project. Including work at our Tim Project with our partner Coeur, we are expecting four drilling programs on Alianza projects in 2022.”

Haldane Silver Project, Keno Hill District, Yukon – 100% Owned

The 2021 campaign at Haldane kicked off after the announcement of high-grade silver mineralization and wide vein intersections in drill hole HLD20-19 early 2021 at the new West Fault target. Drilling commenced in the spring to follow up the result from the 2020 intersection (8.72 m estimated true width averaging 311 g/t silver, 0.89% lead and 1.13% zinc) with 50 metre step outs along strike and down dip, extending mineralization 100 metres along strike and 90 metres down trend. This campaign was highlighted by additional high grade results of 3.14 m estimated true width averaging 1,351 g/t silver, 2.43% lead and 2.91% zinc in hole HLD21-24 including 1.26 m estimated true width averaging 3,267 g/t silver, 5.80% lead and 7.02% zinc. Drilling revealed two splays of strongly mineralized veins within the West Fault Complex. The next phase of drilling will test the West Fault Complex vein mineralization to the southwest and down dip to determine the extent of high grade silver mineralization at this target. This program is planned to commence in the summer with a minimum of 2,000 metres of drilling planned. In addition to the high priority West Fault, plans for additional holes at the Middlecoff and the recently discovered Bighorn targets are being drawn up as well. Program details will be made available once finalized.

Klondike Property, Southwest US Copper Alliance, Colorado – Optioned to Allied Copper

Alianza, together with Alliance partner Cloudbreak Discovery, PLC, a London Stock Exchange listed company, recently optioned the Klondike copper property in Colorado to Allied Copper Corp. (“Allied”) (TSXV:CPR) (see press release dated December 7, 2021). Allied is planning initial remote sensing and magnetics geophysical surveys to be followed by drilling. Recent work by Alianza and Cloudbreak expanded upon known copper mineralization on surface, particularly at the Northeast Fault target, where rock sampling returned 1.56% copper and 1.4 g/t silver over a 4.6 metre chip sample of copper oxides bearing, bleached, bitumen spotted and altered Jurassic sandstones. This target area was traced over 200 metres on strike and over 100 metres in width before becoming obscured under overburden.

Tim Silver Property, Yukon – Optioned to Coeur

Coeur Explorations Inc., a wholly owned subsidiary of silver producer Coeur Mining, Inc., completed SkyTEM airborne geophysics, mapping, soil geochemical sampling and trenching at Tim in 2021. The SkyTEM airborne survey identified several conductors that appear to correlate with oxidized silver-bearing mineralization encountered in historic trenching programs by previous operators. Re-opening of the historic trenches in 2021 exposed oxidized material thought to be related to carbonate replacement mineralization, similar in nature to silver-bearing mineralization seen elsewhere in the region. Analytical results from trench samples are pending. In total, 1,298 soil samples, 38 rock chip and grab samples from the historic trenches, and 4 rock grab samples from regional reconnaissance were collected during the program.

Once all analytical results have been received and compiled by Coeur and provided to Alianza, results will be reported. The Tim Property is located 19km from Coeur’s Silvertip Mine in the Rancheria district of the southern Yukon Territory, Canada. Coeur is earning an 80% interest by completing (i) funding $3.55 million in exploration over five years and (ii) making scheduled cash payments totalling $575,000 over eight years. Coeur must also fund a feasibility study and notify Alianza of its intention to develop a commercial mine on the property by December, 2028.

Twin Canyon Gold Property, Colorado – Available for Option

Exploration at Twin Canyon in 2021 consisted of additional sampling and mapping of mineralization and structures underground at the Charlene Mine in order to help identify controls on mineralization and prioritize drill targets for testing the over 3,000 m by 250 m gold-in-soil geochemical anomaly surrounding the Charlene workings. Management expects to receive a permit for the drill program from the United States Forest Service and Colorado state authorities in short order. Alianza will seek a partner to conduct a ten-hole RC drilling program under the approved permit.

https://www.thenewswire.com/press-releases/1AqRF9ErQ-alianza-minerals-recaps-2021-results-and-outlines-2022-plans.html

Back to Top

Avidian Gold Intercepts 46.63 m Grading 1.08 g/t Au Including 15.24 m Grading 2.03 g/t Au at Golden Zone, Alaska

Mr. Steve Roebuck reports:

TORONTO, ON / ACCESSWIRE / January 19, 2022 / Avidian Gold Corp. ("Avidian" or the "Company") (TSXV:AVG) (OTCQB:AVGDF) is pleased to provide assay results from 8 of the 17 reverse-circulation ("RC") drill holes completed on the Mayflower Extension Zone ("MEZ") at its district-scale (125.5 sq. km) Golden Zone Project in south-central Alaska (Figure 1). Assays results from the remaining 9 holes are pending and will be released when received. The property is strategically located midway between Anchorage and Fairbanks and only 10 km west of paved State Highway 3, the Alaska Railroad, and the 345 kV Alaska Intertie power lines.

Highlights of drill assays received from the northeast 300 m portion of the MEZ (Figure 2) include:

  • Hole GZ21RC-02 intersected 46.63 meters (m) grading 1.08 g/t Au, including 15.24 m grading 2.03 g/t Au - hole ended in mineralization
  • Hole GZ21RC-03 intersected 4.57 m grading 2.87 g/t Au - hole ended in mineralization
  • Hole GZ21RC-26 intersected 7.62 m grading 1.55 g/t Au - farthest MEZ hole drilled to date to the northeast - hole abandoned at 28.96 m, short of target - MEZ remains open along strike and at depth
  • Hole GZ21RC-27 intersected 50.29 m grading 0.70 g/t Au including 7.62 m grading 2.52 g/t Au

Steve Roebuck, President & CEO states: "We are extremely pleased with the success of the 2021 drill campaign at MEZ. The results received to date demonstrate the high potential for the continued discovery of near-surface gold mineralization peripheral to the Breccia Pipe Deposit. The drill program tested shallow gold mineralization along a 600 m strike length and confirms that mineralization remains open along strike and at depth. We are also encouraged that many of the holes intersected multiple mineralized zones, and two holes including our longest intersection inGZ21RC-02, ended in gold mineralization. The consistency of the structural setting along northeast trends at the MEZ and the associated replacement style of mineralization continues to drive our exploration efforts."

The MEZ represents a mineralized structural corridor directly adjacent to, and along strike of, the Breccia Pipe Deposit (Figures 1 & 2). The Breccia Pipe currently hosts a NI 43-101 Indicated gold resource of 267,400 ounces (4,187,000 tonnes grading 1.99 g/t Au) plus an Inferred gold resource of 35,900 ounces (1,353,000 tonnes grading 0.83 g/t Au). The Technical Report on the Golden Zone Property, August 17, 2017, L. McGarry P.Geo & I. Trinder P.Geo, A.C.A Howe International Ltd can be found at www.avidiangold.com.

In 2021 Avidian drilled 1,776.8 m in seventeen (17) shallow RC drill holes at the MEZ as part of a resource expansion program immediately peripheral to the Breccia Pipe Deposit. This drilling campaign was designed to follow up on the 2017 discovery of the previously unknown mineralized conglomerate tested by drill hole GZ17-10. GZ17-10 intersected 21.6 m grading 1.46 g/t Au and is located approximately 300 m northeast of the Breccia Pipe. Additional holes drilled at the MEZ in 2018 include GZ18-02 (approx 50 m to the southwest of GZ17-10; Figure 2) that intersected an upper zone of 5.74 m grading 3.72 g/t Au, and a mineralized zone that appears to correspond to the intersection in hole GZ17-10 that returned 17.7 m of 2.12 g/t Au. GZ18-02 ended in mineralization with an intersection of 17.7 m grading 1.04 g/t Au.

The following table outlines highlights from the northeastern portion of the 2021 MEZ RC drill program. This portion covers a strike length of 300 m of the total 600 m drill tested at the MEZ (Figures 2 & 3).

Hole ID
EOH
(m)
Azimuth (deg.)
Dip
(deg.)
From (m)
To (m)
Length
(m)
Grade (g/t Au)
Comment
GZ21RC-0135.05
135
-50
   NSA
Hole abandoned at 35.05 m and did not reach target *
         
GZ21RC-02121.31
135
-67
74.68
121.31
46.63
1.08
 
Includes
   79.25
94.49
15.24
2.03
 
Includes
   103.63
112.78
9.15
1.14
Hole ends in mineralization
         
GZ21RC-03105.16
135
-50
21.34
28.96
7.62
0.41
 
    44.20
51.82
7.62
1.84
 
Includes
   45.72
50.29
4.57
2.87
 
    67.06
105.16
38.1
0.38
Hole ends in mineralization
Includes
   70.10
88.39
18.29
0.44
 
         
GZ21RC-0462.48
135
-67
38.10
42.67
4.57
0.37
Hole abandoned at 62.48 m
and did not reach target *
    50.29
54.86
4.57
0.30
 
         
GZ21RC-05176.78
135
-67
50.29
73.15
22.86
0.51
 
Includes
   62.48
67.06
4.58
0.99
 
    94.49
134.11
39.62
0.40
 
Includes
   117.35
118.87
1.52
2.37
 
         
GZ21RC-06106.68
135
-50
21.34
28.96
7.62
0.41
 
    51.82
60.96
9.14
0.35
 
    94.49
99.06
4.57
0.33
 
         
GZ21RC-2628.96
135
-62
15.24
22.86
7.62
1.55
Hole abandoned at 28.96 m and did not reach target *
         
GZ21RC-27109.73
135
-60
33.53
83.82
50.29
0.70
 
Includes
   35.05
42.67
7.62
2.52
 

All assays reported in this table are presented in drilled length at this time as there is insufficient data concerning the orientation of the mineralized intersections to calculate true widths.

* Several holes were stopped early and abandoned due to a combination of poor ground conditions and drill power limitations - the target will be retested at a later date

Additional assays are pending for the remaining 9 RC holes in the southwestern portion of the MEZ. Drill hole results were not received in numerical order due to utilization of multiple preparation facilities to speed up turnaround time by fully using all of ALS Global's capacity when available.

Webinar Link

RBMG will be hosting a webinar on Thursday, January 20, 2022 at 2 pm where Avidian President and CEO Steve Roebuck and VP Exploration John Schaff will present the January Investor Presentation including the 2021 drill results from Golden Zone Project and take questions.

Please register at: https://share.hsforms.com/1FxVWd8K1ThOy4gUWOtK0Tw4h2fj

Geological Discussion - Mayflower Extension Zone

Avidian drilled 8 reverse-circulation drill holes (Figures 2 and 3) within the northeast portion of the MEZ. Drill holes GZ21RC-01 through GZ21RC-06 and holes GZ21RC-26 and GZ21RZ-27 (Figure 2) were drilled between 300 m to 600 m northeast of the Breccia Pipe Deposit.

Holes GZ21RC-01 and GZ21RC-02 (Figure 4) were drilled from the same drill site located 40 m to the northeast of holes GZ17-10 and GZ18-01. Hole GZ21RC-01 encountered difficult drilling conditions and was abandoned before reaching its target depth. GZ21RC-02 intersected 46.63 m @ 1.08 g/t Au in sediments comprised of interbedded siltstone, sandstone, and conglomerate cut by numerous structures and near-vertical felsic dikes. This wide zone of mineralization may reflect an association with preferential bedding horizons while the higher grades within the interval appear to be closely associated with narrow structural zones represented by clay fault gouge, increased silicification, and increased pyrite and arsenopyrite content up to 4%. The hole was stopped in weakly altered mineralized sedimentary units (approx 0.3 g/t Au) due to difficult drilling conditions. This mineralization remains open and untested at depth below 121.31 m and appears to be adjacent to a possible intrusive unit (see Figure 4).

Holes GZ21RC-03 and GZ21RC-04 were drilled from the same collar located 50 m northeast of holes GZ21RC-01 and GZ21RC-02. Hole GZ21RC-03 intersected three zones of mineralization hosted mostly in sandstone with lesser amounts of conglomerate. All three mineralized zones appear to be associated with narrow (1-2 m wide) quartz-feldspar porphyry dikes including an interval of 7.62 m @ 1.84 g/t Au. The bottom portion of the hole had a continuous 38.1 m @ 0.38 g/t Au interval of mineralization indication that this zone remains open at depth. GZ21RC-04 was drilled under GZ21RC-03 and only encountered two short zones of weak mineralization (<0.37 g/t Au) before ground conditions deteriorated and the hole was stopped before reaching the target depth.

Holes GZ21RC-05 and GZ21RC-06 (Figure 5) were drilled on separate sites but only 10 m apart with GZ21RC-05 intersecting two wide zones of mineralization including 22.86 m @ 0.51 g/t Au and 39.62 m @ 0.40 g/t Au. These two mineralized zones have increased pyrite, pyrrhotite, and arsenopyrite contents up to 5%, and are hosted mostly in conglomerate and to a lesser extent in the sandstone package, and also contain an apparent increase in the abundance of both quartz-feldspar porphyry and monzodiorite dikes. Alteration of the conglomerate unit appears to be of replacement style mineralization with skarn type mineral assemblages including pyrite, pyrrhotite, magnetite, calcite, chlorite, and diopside. Hole GZ21RC-06 was drilled at a flatter angle (above) hole GZ21RC-05 and returned several narrow intersections.

Hole GZ21RC-26 was the northeasternmost hole drilled in the MEZ to date, successfully extending the zone an additional 185 m past previous drill holes GZ17-10 and GZ18-01. Even though hole GZ21RC-26 was terminated well short of its targeted depth, it unexpectedly intersected a zone grading 7.62 m @ 1.55 g/t Au and 13.44 g/t Ag including a 3.05 m @ 2.7 g/t Au. This mineralized interval contains 70% quartz veining, 20% arsenopyrite, and 2% pyrite hosted within a >15.24 m quartz-feldspar porphyry dike (hole terminated in the dike). This hole provides Avidian with the justification to continue our expansion drilling and exploration efforts to the northeast and test for a possible new mineralized horizon both along strike and at depth.

The last hole of the season, Hole GZ21RC-27, was drilled in between sites GZ21RC-01/02, and 03/04 in an attempt to test the zone at depth since holes GZ21RZ-01 and GZ21RC-04 failed to reach their target depths. This hole intersected a relatively shallow zone of 50.29 m @ 0.70 g/t Au that included 7.62 m @ 2.25 g/t Au (see Figure 4) hosted in a zone of strongly clay altered quartz-feldspar porphyry. This mineralization appears to be associated with increased sulphide content of up to 3% pyrite, 1% pyrrhotite, and arsenopyrite.

Quality Control/Quality Assurance

Sampling included insertion of certified standards and blanks into the stream of samples for chemical analysis. Every twentieth drill hole sample was a standard or a blank. Due to the global sample preparation and assay backlog, samples were prepared at ALS Global's laboratory in either Fairbanks, Alaska; Hermosillo, Mexico; or Thunder Bay, Ontario, Canada and shipped to their Vancouver facility for gold analysis by fire assay and other elements by ICP analysis. ALS is a certified and accredited laboratory service. Gold values varied from below detection to a high of 6.64 g/t Au and silver values ranged from below detection to a high of 41.2 g/t Ag.

About Avidian Gold Corp.

Avidian brings a disciplined and veteran team of project managers together with a focus on advanced-stage gold exploration projects in Alaska. Additional projects include the Amanita and the Amanita NE gold properties which are both adjacent to Kinross Gold's Fort Knox gold mine in Alaska, and the Jungo gold-copper property in Nevada.

Avidian's majority-controlled High Tide Resources is a private corporation that is focused on, and committed to, the development of advanced-stage mineral projects in Canada using industry best practices combined with a strong social license from local communities. High Tide is earning a 100% interest in the Labrador West Iron project located adjacent to IOC/Rio Tinto's 23 mtpy Carol Lake Mine in Labrador City, Labrador and owns a 100% interest in the Lac Pegma copper-nickel-cobalt deposit located 50 km southeast of Fermont, Quebec.

Further details on the Company and the individual projects, including the NI 43-101 Technical reports on the Golden Zone property and Labrador West Iron property can be found on the Company's website at www.avidiangold.com

https://www.juniorminingnetwork.com/junior-miner-news/press-releases/2426-tsx-venture/avg/114223-avidian-intercepts-46-63-m-grading-1-08-g-t-au-including-15-24-m-grading-2-03-g-t-au-at-golden-zone-alaska.html

Back to Top

ASX: Gold miners shine bright, Woodside and Santos book record numbers

Frydenberg: Unemployment at lowest in 13 years The Australian sharemarket inched higher despite a negative US lead, with gold miners the star performers, while Woodside and Santos reported record numbers as oil prices climbed to multi-year highs. Picture: James Gourley / NCA NewsWire

The Australian sharemarket inched higher despite a negative US lead, with gold miners the star performers, while Woodside and Santos reported record numbers as oil prices climbed to multi-year highs.

Snapping a two-day losing streak, the benchmark S&P/ASX200 index finished just 9.9 points or 0.14 per cent higher at 7342.4, while the All Ordinaries Index firmed 12.3 points or 0.16 per cent to 7668.9.

CommSec’s Ryan Felsman and Divik Nigam said jitters surrounding rising US interest rates dented sentiment on Wall Street, with the tech-heavy Nasdaq index faring the worst – down 1.2 per cent and notching up its 66th correction since 1971.

Among local tech stocks, Dicker Data fell 6.08 per cent to $13.32 and Jack Dorsey’s Block made its ASX debut after taking over Afterpay, starting at $176.08 and closing 55 cents higher.

OMG chief executive Ivan Tchourilov said the mining and energy sectors fared the best, with Northern Star Resources leading the ASX200, rocketing 11.2 per cent to $9.73.

“The gold mining company released its quarterly report this morning, indicating it had produced in line with expectations on two of three major mining sites and confirmed that it’s on track to meet FY22 expectations,” Mr Tchourilov said.

The spot gold price is currently about $US1840/oz, compared to RBC Capital Markets’ 2022 forecast of $US1695/oz. Picture: David Gray / AFP

RBC Capital Markets analyst Alexander Barkley described it as a “reasonable” quarter, noting Northern Star’s Pogo mine in Alaska had dragged down the numbers, saying the operation would likely struggle to meet its full-year guidance.

Another producer of the precious metal, Evolution Mining, jumped 8.92 per cent to $4.15, making it the second best performer in the top 200.

Copper and gold producer Sandfire Resources issued its quarterly, maintaining its full-year production guidance, but lifting its costs forecast, saying mining, transport and shipping costs had all risen.

Sandfire shares gained 2.5 per cent to $7.37, still well below RBC Capital Markets’ target price of $8.75.

Mr Tchourilov said Australian coking coal, an essential input in steel production, hit a record high of $US430 per tonne on Wednesday despite China’s ongoing ban.

https://www.theaustralian.com.au/news/latest-news/australian-sharemarket-edges-higher-buoyed-by-mining-and-energy-stocks/news-story/9160f41fa2c4b91c359db04dfb1f0795

Back to Top

Base Metals

A Copper Crisis Threatens The Energy Transition

The supply shortage will almost certainly boost recycling levels as demand is only set to grow

Global demand for copper is forecast to outstrip supply by more than six million tonnes by 2030

Global demand for copper, an essential component in manufacturing electric vehicles (EVs) and consumer electronics, will outstrip supply by more than six million tonnes by 2030, Rystad Energy projects. A deficit of this magnitude would have wide-reaching ramifications for the energy transition as there is currently no substitute for copper in electrical applications. Significant investment in copper mining is required to avoid the shortfall.

Copper demand is projected to rise 16% by the end of the decade, reaching 25.5 million tonnes per annum (tpa) by 2030, compared with a supply forecast showing a 12% decrease versus 2021 levels. Estimates based on current and expected projects show supply will clock in at 19.1 million tpa, falling well short of the quantity needed to meet demand.

Investment in copper mining is risky as current operations are near peak capacity due to ore quality and reserves exhaustion, exerting upward pressure on production costs and emissions. However, copper prices are currently high, which could encourage investors to accept a greater level of risk.

“Lackluster investments in copper mining are stumping supply, as the pandemic-driven market instability encourages investors to hold on to their capital. As the energy transition continues at pace and EV adoption grows in populous nations like China and India, the copper mining industry requires significant investment to keep up with demand,” says James Ley, global energy metals expert and Senior Vice President with Rystad Energy.

The growing renewables and EV markets have pushed copper demand higher, causing prices to soar. Prices have risen 70% during the pandemic. The current spike in infection cases, due mainly to the spread of the Omicron variant, is causing further supply chain bottlenecks, leaving prices at all-time highs entering 2022.

The outlook for copper investment paints a bleak picture for future supply, indicating a significant supply deficit could emerge from 2023 onwards. The expected demand increase is due to the market growth of renewables – solar, onshore and offshore wind, among others – EVs, construction and electronics. With India’s projected economic growth and the buildout of EVs from China, the demand projection could end up being conservative and the supply shortfall even more severe.


Copper PR.jpg

Chart source: https://www.rystadenergy.com/newsevents/news/press-releases/copper-supply-deficit-of-6-million-tons-by-2030-threatens-renewables-evs-as-investment-lags-demand/

Supply concerns

Copper mining is an energy-intensive process that produces a large amount of carbon emissions. The government of Peru, one of the world’s largest exporters of copper, ordered several mines to close in November 2021 amid environmental protests. As a result, four mines in the southern Ayacucho region could be barred from further expansion, which would dent the copper, silver, and gold portfolio of large UK-based minerals producer Hochschild Mining. In addition, the Las Bambas copper mine in southern Peru that produces 400,000 tpa of the material – or about 2% of global supply – will reportedly shut production due to transportation issues. Political instability in neighboring Chile, another major producer, further adds to the supply problems.

In recent years, mining investors have been primarily focusing on the lowest-risk projects, while also offering high dividends. Coupled with the ongoing issues of pandemic lockdowns, work stoppages, and delays, copper supply growth has decelerated.

A supply deficit could cause projects in many industries to experience lengthier lead times, especially when considering copper demand from all sectors combined is projected to grow 32% by 2040, compared with 2020 levels. This includes the contributions of solar, onshore/offshore wind, hydroelectric, biomass, and nuclear. Demand for oil and gas is expected to fall, with global production of these fossil fuels also expected to decrease.

Since 75% of mined copper is used in electrical wires, power grids, and motherboards, it is an indispensable commodity. Due to continued demand growth outpacing available supply, intermittent supply shortages would likely significantly impact raw copper rather than semi-finished product inventory.

New discoveries

New copper resources continue to be discovered – such as Grasberg in Indonesia and Kamoa-Kakula in the Democratic Republic of Congo (DRC) – yet many remain undeveloped as potential mines can suffer from low ore grades and fiscal or political uncertainty in the host country can delay development. Interestingly, UK brokerage Marex Spectron sees the potential for 2022 offering a copper surplus, saying in December 2021 that major new projects – such as Teck’s QBII mine in Chile and Anglo American’s Quellaveco project in Peru – could add 200,000 tpa. Ivanhoe’s mine in the DRC could add another 70,000 tpa, while the ramp-up at Freeport’s Grasberg mine could add a further 110,000 tpa. However, despite this supply growth potential, projects will require a politically stable environment, and their operators must be mindful of the emissions targets to entice would-be investors.

Mining companies are still among the highest dividend payers, and new copper discoveries remain undeveloped mainly due to perceived risks. Overall, any copper supply shortages will almost certainly encourage greater recycling levels to boost availability.

https://oilprice.com/Energy/Energy-General/A-Copper-Crisis-Threatens-The-Energy-Transition.html

Back to Top

Antofagasta (LON:ANTO) Price Target Cut to GBX 1,350 by Analysts at JPMorgan Chase & Co.

Antofagasta (LON:ANTO) had its price target reduced by JPMorgan Chase & Co. from GBX 1,360 ($18.46) to GBX 1,350 ($18.32) in a research note published on Thursday, PriceTargets.com reports. They currently have a neutral rating on the mining company’s stock.

A number of other brokerages also recently weighed in on ANTO. Peel Hunt reiterated an add rating and issued a GBX 1,550 ($21.04) price target on shares of Antofagasta in a report on Thursday, October 28th. Barclays lowered their price target on Antofagasta from GBX 1,100 ($14.93) to GBX 1,050 ($14.25) and set an underweight rating for the company in a report on Thursday, December 16th. Deutsche Bank Aktiengesellschaft reiterated a hold rating and issued a GBX 1,300 ($17.65) price target on shares of Antofagasta in a report on Wednesday, December 15th. Morgan Stanley restated an underweight rating and set a GBX 1,060 ($14.39) price objective on shares of Antofagasta in a research note on Thursday, November 25th. Finally, Liberum Capital restated a hold rating and set a GBX 1,350 ($18.32) price objective on shares of Antofagasta in a research note on Tuesday, December 7th. Three research analysts have rated the stock with a sell rating, five have issued a hold rating and two have assigned a buy rating to the stock. According to data from MarketBeat, the company has a consensus rating of Hold and a consensus target price of GBX 1,343.33 ($18.23).

ANTO stock opened at GBX 1,379 ($18.72) on Thursday. Antofagasta has a 52-week low of GBX 1,279.20 ($17.36) and a 52-week high of GBX 1,972 ($26.77). The company has a quick ratio of 2.53, a current ratio of 2.86 and a debt-to-equity ratio of 33.80. The company has a market capitalization of £13.59 billion and a PE ratio of 17.63. The stock’s 50 day moving average is GBX 1,384.50 and its two-hundred day moving average is GBX 1,416.57.

https://etfdailynews.com/news/antofagasta-lonanto-price-target-cut-to-gbx-1350-by-analysts-at-jpmorgan-chase-co/

Back to Top

METALS-London copper edges higher on low stocks, firm dollar caps gains

Jan 17 (Reuters) - Copper prices edged higher on Monday, drawing support from tight supply, but gains were limited by a firmer dollar as investors raised bets on several U.S. rate hikes this year.

Three-month copper on the London Metal Exchange edged 0.2% higher to $9,742.5 a tonne by 0700 GMT. Prices fell 2.4% on Friday, marking the biggest decline since Nov. 26.

The most-traded February copper contract on the Shanghai Futures Exchange closed down 1.8% at 70,170 yuan a tonne.

"COVID-19 is still causing logistical issues globally and delays in trading activities make for smaller inventory levels than ever before," CRU analyst He Tianyu said.

On-warrant LME copper inventories were at 78,375 tonnes, down 67% from August highs.

Stocks in warehouses monitored by the Shanghai Futures Exchange were at 30,330 tonnes, hovering close to their lowest level since 2009.

Prices are expected to be volatile amid low inventory levels and declining consumption ahead of the Chinese Spring Festival holidays, Jinrui Futures wrote in a note.

Meanwhile, data showed top metal consumer China's economy rebounded in 2021 from its pandemic-induced slump but weak consumption at the year-end and a property slowdown point to cooling momentum and the need for more policy support.

The People's Bank of China cut loan rates to cushion risks of a further economic slowdown.

Capping further advance in prices, the dollar held to gains, after bouncing off a more than two-month low in the previous session. [USD/]

FUNDAMENTALS

* LME aluminium rose 0.6% to $2,995 a tonne, nickel eased 0.2% to $22,155 a tonne, lead rose 0.6% to $2,370, zinc was up 0.2% at $3,529.5 and tin gained 0.4% to $40,500.

* The premium for cash nickel over the three-month contract jumped to $376.50 per tonne, the highest since April 2009, suggesting tightness in nearby supplies. Meanwhile, nickel inventories in LME-registered warehouses were at 97,746 tonnes, the lowest since December 2019.

* Stocks in Shanghai Futures Exchange warehouses are close to record lows at 4,711 tonnes.

* ShFE aluminium fell 0.5% to 21,125 yuan a tonne, nickel was down 0.9% at 162,580 yuan, zinc dropped 1.5% to 24,545 yuan, lead rose 0.5% to 15,660 yuan and tin edged 0.3% higher to 308,080 yuan.

* China's aluminium output for 2021 hit a record high, official data showed, though monthly output in December fell from the corresponding period in the previous year.

(Reporting by Eileen Soreng in Bengaluru; Editing by Shounak Dasgupta) ((eileen.soreng@thomsonreuters.com; Within U.S. +1 646 223 8780, Outside U.S. +91 80 6749 6131; Reuters Messaging: eileen.soreng.thomsonreuters.com@reuters.net)) (( For related news and prices, click on the codes in brackets: LME price overview

https://www.nasdaq.com/articles/metals-london-copper-edges-higher-on-low-stocks-firm-dollar-caps-gains

Back to Top

China demand doubts and rising inventories pressure copper

LONDON: Copper prices came under pressure on Monday as economic data from top consumer China suggested slowing demand for industrial metals while inventories rose in warehouses registered with the London Metal Exchange (LME).

Benchmark copper on the LME fell 0.7% to $9,652 a tonne by 1153 GMT. The metal used widely in the power and construction industries touched $10,072 last week for its highest since Oct. 21.

"Metals-intensive sectors of China's economy continued to cool in December. Investments into the infrastructure and property sectors are still shrinking," said Julius Baer analyst Carsten Menke.

Copper holds near $10,000 a tonne as traders eye new rally

"The longer-term outlook for the property market is characterised by structural challenges related to a shrinking working age population and slowing urbanisation."

CHINA: Property investment in China dropped by 13.9% year on year in December, falling at the fastest pace since early 2020. Investment grew 4.4% in 2021, the slowest annual growth since 2016.

INVENTORIES: Stocks of copper in LME-registered warehouses rose by 6,550 tonnes to 92,850 tonnes, easing fears of tighter supplies on the LME market.

ALUMINIUM: China's annual aluminium output hit a record high of 38.5 million tonnes in 2021, though December output fell from the same month last year.

"Chinese production shrank for a fourth consecutive month in December, reflecting regulatory as well as environmental constraints," Menke said.

"Adding in supply curtailments in Europe because of record-high electricity prices, the aluminium market's supply cushions seem to be shrinking."

Benchmark aluminium climbed above $3,000 a tonne last week to its highest since Oct. 21. It was last down 0.2% at Reuters

NICKEL: Dwindling stocks in LME-registered warehouses and in those monitored by the Shanghai Futures Exchange (ShFE) fuelled nickel's rally last week to $22,935 tonnes, its highest since August 2011.

Worries about availability of nickel that can be delivered against LME and ShFE contracts have created significant premiums for near-term contracts.

Three-month nickel slipped 1.5% to $21,870 a tonne.

OTHER METALS: Zinc rose 0.2% to $3,528, lead gained 0.2% to $2,360 and tin was up 0.5% at $40,550.

https://www.brecorder.com/news/40147773/china-demand-doubts-and-rising-inventories-pressure-copper

Back to Top

Nickel Exploding.

Back to Top

Universal Copper Intercepts 479.75 m of 0.56%CuEq From Surface at Poplar

VANCOUVER, British Columbia, Jan. 18, 2022 (GLOBE NEWSWIRE) -- Universal Copper Ltd. ("Universal Copper" or the "Company") (TSX Venture: UNV) (Frankfurt: 3TA2) is pleased to announce the first drilling results from its 2021 diamond drilling program at the Company’s flagship Poplar Copper Deposit (“Poplar”), located southwest of Houston, British Columbia.

Highlights:

  • Hole 21-PC-133 – 479.75 metres at 0.56% copper equivalent (CuEq)– 0.408% copper, 0.013% molybdenum, 0.13 g/t gold and 2.89 g/t silver
    • including 68.25 metres at 0.655% copper, 0.016% molybdenum, 0.17 g/t gold and 2.92 g/t silver
  • Hole 21-PC-132 – 186.35 metres at 0.436% copper, 0.019% molybdenum, 0.10 g/t gold and 1.72 g/t silver

Clive Massey, Universal Copper’s CEO, stated: “We are very pleased by the recent drill success at Poplar, and we look forward to further expanding our high-grade copper-gold zones in 2022.  Drill hole 21-PC-133 is an especially long intercept starting at surface with very robust grades (480 metres of 0.56% CuEq) on par with high-quality exploration/development stage projects elsewhere in North America.  Similar to the recent Kodiak (MPD1) and (HudBay ) discoveries, we are excited to be building copper resources from surface in a project with existing power, road, and rail access.”

Table 1. 21-PC-132 and 21-PC-133 Intersections


Hole No
m from
m to
m length
g/t Au
g/t Ag
% Cu
Mo ppm
Cu Eq.
21-PC-132
5.65
192
186.35
0.10
1.72
0.436
0.019
0.59
21-PC-133
21.25
501
479.75
0.13
2.89
0.408
0.013
0.56
21-PC-133
247.25
315.5
68.25
0.17
2.92
0.655
0.0156
0.84


Copper equivalents based on the following: copper US$9,972.10 per tonne, gold US$1,816.60 per ounce, silver US$22.90 and molybdenum US$41,836.39 per tonne.

Because of the disseminated nature of the mineralization at the Poplar Deposit, it is not possible to make a statement as to the true width for holes 21-PC-132 and 21-PC-133.

https://www.universalcopper.com/images/gallery/UNV_News_41.jpg

The 2021 Poplar drill holes were all drilled vertically, designed to test for continuity of copper-gold mineralization, test for extensions to depth, improve the understanding of mineralization geometry, and to infill gaps within possible high-grade mineralized volumes.  The company plans to use the 2021 drill core material for metallurgical test work as well as geological/resource evaluation and testing going forward in 2022. 

https://www.universalcopper.com/images/gallery/UNV_News_42.jpg

Mineralization consists predominantly of pyrite, chalcopyrite and molybdenite associated with strongly altered intrusive rocks. Pyrite and chalcopyrite occur as disseminations, stringers, veins, and veinlets in domains of strongly developed quartz vein stockworks and porphyry dikes. Molybdenite, where observed is almost exclusively associated with quartz-sulphide veins, typically pyrite and chalcopyrite, but sphalerite was also present in several veins. Potassic alteration of varying intensity and silicification were noted throughout 21-PC-133, consisting of biotite and K-feldpar, with zones of phyllic and propylitic alteration noted through the central section of the drill hole. Biotite flooding was common in the upper portion of the hole.

Universal plans to deploy upcoming drill campaigns in 2022 to increase the mineralized volume for the high-grade copper domains at Poplar as well as testing for 1) extensions to known mineralized zones, and 2) new brownfields copper-gold zones. 

Table 2. Drill Hole Data

 
21-PC-132 Statistics
 
21-PC-133 Statistics
 
ppm Cu
ppm Mo
g/t Au
g/t Ag
 
ppm Cu
ppm Mo
g/t Au
g/t Ag
Max
7750
1250
0.22
25.80
 
35500
608
0.85
31.00
Min
175
2
0.002
0.11
 
1420
11
0.04
0.39
Median
1910
96
0.03
0.72
 
3910
101
0.13
1.97
Mean
1807
73
0.03
0.71
 
3863
89
0.12
2.01

QA/QC

The entire length of core for 21-PC-132 and 21-PC-133 was sawn and sampled at continuous 3 metre or less intervals, with a few samples taken at shorter or longer intervals based on apparent lithological, alteration or mineralization contact. The program was supervised by independent geologist Ray Wladichuk, P.Geo. Half of the core was bagged, sealed and securely stored until shipment to the laboratory. The other half was retained in a secure storage location. Certified reference standards, a certified reference blank, and sample duplicates were placed in the sample stream of each drill hole alternating at every 10th to 18th interval. The secured and sealed samples were packed into rice bags, sealed and securely stored until they were turned over to the local trucking company for transport to the ALS Mineral Laboratory ("ALS") in North Vancouver, B.C. The North Vancouver lab holds an ISO/IEC 17025:2005 accreditation.

All core samples were analyzed utilizing ALS's MEICP-61 procedure, a four-acid digestion of a one-gram sample with an ICP finish. All core samples were also analyzed utilizing ALS’s Au-ICP21 procedure, a 30-gram gold fire assay with an ICP-AES finish. Over limits were re-analyzed utilizing ALS’s OG-62 procedure, an ICP-AES 4 acid procedure.

In addition to Universal’s third-party standards, a routine quality assurance/quality control (QA/QC) procedure monitored the analytical quality at the lab. Certified reference materials (CRMs), pulp duplicates and blanks were inserted into each lab batch of samples. The Universal and ALS Lab QA/QC data showed no irregularities.

About Poplar

The 61,566-hectare Poplar Project hosts a current undiluted indicated mineral resource of 152.3 million tonnes grading 0.32 per cent copper, 0.009 per cent molybdenum, 0.09 gram per tonne gold and 2.58 g/t silver and an undiluted inferred mineral resource of 139.3 million tonnes grading 0.29 percent copper, 0.005 percent molybdenum, 0.07 g/t gold and 4.95 g/t silver. The mineral resource estimate has a cut-off grade of 0.20% copper. Universal Copper cautions investors mineral resources, which are not mineral reserves, do not have demonstrated economic viability.

Poplar lies in a historic mining region, located 35km from the Huckleberry Mine and 42km from Equity Silver Mine, where low snowfalls will allow year-round work. The road accessible property is bisected by a 138 Kva Hydro electric line and lies 88km from Houston and 400km from the deep-water port at Prince Rupert by rail.

References

1https://kodiakcoppercorp.com/news/news-releases/kodiak-reports-complete-drill-results-for-mpd-20-004-535.1-m-of-0.49-copper-and-0.29-g-t-gold-0.76-cueq/

2https://hudbayminerals.com/investors/press-releases/press-release-details/2021/Hudbay-Announces-Significant-New-Discovery-at-its-Copper-World-Properties-Adjacent-to-Rosemont/default.aspx


https://www.globenewswire.com/news-release/2022/01/18/2368486/0/en/Universal-Copper-Intercepts-479-75-m-of-0-56-CuEq-From-Surface-at-Poplar.html

Back to Top

Copper Mountain Mining Initiates Copper Price Protection Program

VANCOUVER, BC, Jan. 19, 2022 /PRNewswire/ - Copper Mountain Mining Corporation (TSX: CMMC) (ASX: C6C) (the "Company" or "Copper Mountain") announces it has entered into a series of zero-cost collar option contracts. The contracts cover 3.3 million pounds of copper per month through 2022, for a total of 39.6 million pounds of copper. The floor price of the monthly copper options has been set at US$4.00 per pound with an average ceiling price of US$4.91 per pound.

Copper Mountain Mining Corporation Logo (CNW Group/Copper Mountain Mining Corporation)

Gil Clausen, Copper Mountain's President and CEO, commented, "We initiated a zero-cost collar copper price protection program this month as we believe it is prudent for us to protect our margins as we invest in our projects this year. This is in line with our strategy to be environmentally and financially judicious, as we move forward with our growth plans. The detailed engineering is progressing well at the Eva Copper Project. We are also continuing to advance the installation of an additional concentrate cleaner flotation cell and another filter press, together with new rougher flotation cell capacity at the Copper Mountain Mine."

https://finance.yahoo.com/news/copper-mountain-mining-initiates-copper-130000548.html

Back to Top

Copper prices rise as China signals more policy support

Jan 19 (Reuters) - Copper prices firmed on Wednesday, supported by expectations of further policy easing in top metals consumer China offsetting pressure from a firmer U.S. dollar and rise in inventories.

Three month copper on the London Metal Exchange was up 0.4% at $9,718 a tonne, as of 0725 GMT, while the most-traded March copper contract on the Shanghai Futures Exchange ended flat at 70,020 yuan ($11,028.51) a tonne.

Sentiment in the metals market was supported by expectations of more rate cuts in China, analysts at ANZ said in a note. "Together with further measures, GDP growth should stabilise this year."

https://www.reuters.com/markets/europe/copper-prices-rise-stimulus-hopes-top-consumer-china-2022-01-19/

Back to Top

Supply squeeze pushes nickel up 5% to 11-year high

LONDON, Jan 19 (Reuters) - Nickel prices on Wednesday shot to their highest since 2011 as a supply shortage forced traders to pay huge premiums to get their hands on metal.

Benchmark nickel on the London Metal Exchange (LME) was up 5% at $23,170 a tonne at 1707 GMT after reaching $23,220. It was heading for its biggest one-day gain since October.

Used in stainless steel and for batteries for electric vehicles, nickel is up around 11% this year after rising 25% in 2021 and 18% in 2020.

With exchange stockpiles falling, the tom/next and cash-to-three-month spreads surged to their highest in more than 10 years this week, prompting the LME to say it was monitoring the market. Premiums eased on Wednesday. ,

"We're bullish for nickel," said Sucden analyst Geordie Wilkes. "We could see some softness in the near term but that's nothing to worry about when you look at the fundamentals."

INVENTORIES: Stocks in LME-registered warehouses have fallen to 94,830 tonnes from more than 260,000 tonnes in April. Inventories in Shanghai Futures Exchange warehouses, at 4,711 tonnes, are near record lows. ,

COLUMN: The nickel market is experiencing a severe squeeze, writes Reuters columnist Andy Home.

https://www.reuters.com/markets/europe/supply-crunch-holds-nickel-near-11-year-highs-2022-01-19/

Back to Top

Barksdale Intercepts 47m of 0.75% Copper and 39m of 0.61% Copper at San Javier in Sonora, Mexico

Vancouver, British Columbia–(Newsfile Corp. – January 19, 2022) – Element 29 Resources Inc. (TSXV: ECU) (OTCQB: EMTRF) (“Element 29” or the “Company“) is pleased to announce results from the last three drill holes of the seven-hole, 4,500 metre (“m“) drilling program completed in December 2021 at its 100% owned Elida Copper Project (“Elida” or “the Project“) located in central Perú (Figure 1).

Richard Osmond, Chairman and Interim CEO, comments, “The Phase 1 drill program at Elida was a complete success and exceeded expectations with several long intercepts of strong copper mineralization starting at the bedrock surface and, in the case of drill hole ELID025, mineralization extended to depths greater than 900 m. The program was successful in defining the limits of copper mineralization at Target 1 with the appropriate drill spacing needed to complete an initial resource estimate, which we expect to publish later this year. We are excited about our plans to move forward with a Phase 2 program intended to expand on potential resources at Target 1 and drill test Targets 2 and 3.”

Elida Drilling Highlights

Drill hole ELID025 intersected 908.75 m of 0.39% copper (“ Cu “), 0.035% molybdenum (“ Mo “), and 2.9 g/t silver (“ Ag “) for 0.55% copper equivalent 1 (“ CuEq “, see footnote 1 in Table 1 ), including 339.6 m of 0.50% Cu, 0.036% Mo and 4.3 g/t Ag for 0.67% CuEq 1 starting from the bedrock surface at 38.45 m depth ( Figure 2 ). The hole confirmed the vertical extent of mineralization to 933 m below surface and remains open at depth.

https://www.nxtmine.com/news/articles/todays-news/tsxv-bro-barksdale-intercepts-47m-of-0-75-copper-and-39m-of-0-61-copper-at-san-javier-in-sonora-mexico/

Back to Top

Fox River Update

VANCOUVER, British Columbia, Jan. 20, 2022 (GLOBE NEWSWIRE) — Marimaca Copper Corp. (“Marimaca Copper” or the “Company”) (TSX: MARI) is pleased to announce ‘Exploration Targets’ for the Marimaca Oxide Deposit (“MOD”) depth extension zone (the “MAMIX” target) discovered in 2021 (see announcement dated October 14 2021), as well as for the Mercedes, Cindy and Roble satellite oxide targets discovered during the successful 2021 Marimaca District exploration drilling campaigns (see announcements dated September 15 2021, July 14 2021 and July 1 2021).

Highlights

Exploration Targets demonstrate potential to grow Marimaca’s existing Mineral Resource Estimate (“MRE”) of 70.7m tonnes at 0.60% CuT in Indicated and 43.4m tonnes at 0.52% CuT in Inferred categories for 424kt and 226kt of contained copper, respectively (see announcement dated August 4 th , 2020)

>25,000m drilling planned for 2022 across the MOD infill, MAMIX zone, and further drill testing the Mercedes target

MAMIX (MOD Depth Extension)

MAMIX Exploration Target Range of 30 million – 50 million tonnes at 0.4% – 0.5% CuT

MAMIX infill drilling program in planning phase, targeting completion in H1 2022 alongside the 22,500m MOD infill drilling program MAMIX drilling will investigate potential for further extensions at depth to the north and south of the MOD Assuming a successful outcome to the 2022 drilling program, the Company will consider increased production cases for the upcoming Definitive Feasibility Study planned for H2 2022

Satellite Oxide Targets and MOD Oxide Extensions

Total oxide Exploration Target of 120 million – 170 million tonnes at 0.3% to 0.4% CuT across oxide satellite discoveries Mercedes, Cindy and Roble, and the MOD north-south extension zones Potential to play an important role in future oxide mine life extensions Mercedes remains the highest priority satellite target, with additional drilling planned for H2 2022 Discoveries confirm district scale potential across the Company’s land package, with other targets identified through district scale geophysics remaining to be followed up (see announcement dated September 23, 2020)

Definitive Feasibility Study

Drill crews now mobilized to commence 22,500m MOD infill program

Updated MOD Mineral Resource Estimate planned for late Q2 2022

The Company continues to progress project related technical work streams including the Phase 5 Metallurgical program, permitting, water and power engagement and planning for the Definitive Feasibility Study

The potential quantity and grade presented in the exploration target ranges are conceptual and have insufficient exploration and drill density to define a Mineral Resource. At this stage, it is uncertain if further exploration will result in the targets being delineated as a Mineral Resource. Estimates of exploration targets are not Mineral Resources and are too speculative to meet the NI 43-101 reporting standards. The detailed methodology for preparing the Exploration Targets and a summary of supporting technical data can be found at the end of this announcement.

https://www.nxtmine.com/news/articles/todays-news/cse-fox-fox-river-announces-update-on-martison-phosphate-project-pea/

Back to Top

Top Copper Mining Stocks to Invest In

Copper mining stocks and ETFs are popular options for investors looking to board the copper train, with copper being one of the world’s most important commodities seeing soaring demand,

The global transition to electrification and a low-carbon future is driving copper demand. It is used extensively in electrical applications and power generation for renewable energy and electric vehicles.

Copper is also used in construction because it doesn’t burn, melt or release toxic fumes in the event of a fire. Its timeless, shiny finish also looks good.

Will there be a copper bull run?

Copper prices are projected to double in the coming decade as the clean energy transition mounts.

The theory copper bulls stand by is that copper supplies will soon run low.

Given that higher copper prices bring higher copper production, this could initiate a self-perpetuating cycle. A possible scenario sees a soaring copper price pushing up production, leading supplies to run low while demand strengthens.

Another scenario playing out is production reducing as metal grades decline. Indeed, BHP Group (NYSE: BHP) and Rio Tinto (NYSE: RIO) have already noted declines in 2021 production numbers.

Although price fluctuations can be expected, the result could be a baseline of higher copper prices and thus elevated prices for copper mining stocks.

While copper mining stocks initially dipped as COVID-19 caused demand to shrink in the first half of 2020, the copper price soon began to rally later that year. Strong demand from China, tight scrap markets, supply disruption and a return in investor positioning into material and commodity markets brought the copper price higher and copper mining stocks with it.

Between March 2020 and May 2021, the price of copper soared over 126%. It even topped $10,000 for the first time in a decade. Since then, it’s been subject to extreme volatility at a suppressed price point.

Top copper mining stocks to invest in

Hot copper mining stocks linked to the clean energy and the EV manufacturing boom include Freeport McMoRan (NYSE: FCX) and Teck Resources (NYSE: TECK).

Meanwhile, copper mining stocks that fared well during the copper price rise but have since declined include BHP Group, Southern Copper Corp (NYSE: SCCO), Ero Copper Corp (NYSE: ERO) and Rio Tinto.

Here are some copper mining stocks to consider investing in:


Freeport McMoRan (NYSE: FCX)

Teck Resources (NYSE: TECK)

Southern Copper Corp (NYSE: SCCO)

Ero Copper Corp (NYSE: ERO)

Rio Tinto (NYSE: RIO)


Is there a Copper Mining ETF?

There are copper mining ETFs. COPX, CPER, and JJC are a few of them.

Global X Copper Miners ETF (NYSEARCA: COPX)

COPX is a US ETF tracking a market-cap-weighted index of global copper mining companies. The Global X Copper Miners ETF is the first ETF option for pure-play copper exposure in the equity space. As of January 2022, it has $1.82bn worth of Assets Under Management (AUM). Its trailing twelve-month distribution yield is 1.37%.

https://www.valuethemarkets.com/analysis/top-copper-mining-stocks-to-invest-in

Back to Top

Capstone Enters Into Exploration Access Agreement With BHP Copper Inc. for Copper Cities Project

VANCOUVER, British Columbia--(BUSINESS WIRE)--Capstone Mining Corp. (“Capstone” or the “Company”) (TSX:CS) is pleased to announce that it has entered into an 18-month access agreement to conduct drill and metallurgical test work at BHP Copper Inc.’s (“BHP”) Copper Cities project (“Copper Cities”) located 10 km east of the Pinto Valley Mine (“Pinto Valley”).

Darren Pylot, Capstone’s CEO commented, “ I am excited that we have started test work on a property neighbouring our flagship Pinto Valley operation.” Mr. Pylot added, “ Historic drill data from over 300 holes suggest a shallow copper target and a potentially low strip ratio pointing to a significant development opportunity.”

Brad Mercer, Capstone’s SVP Strategic Projects and Exploration said, “ We believe Copper Cities is geologically a mirror image of Pinto Valley with the same host rocks and age. Our plan currently underway calls for a $6.7 million two phase drill program aimed at twinning historical drill holes and to select a portion of these for metallurgical testing. Discussions between Capstone and BHP are at an early stage.”

About Copper Cities Project

Copper Cities was developed in the 1950s as a part of America’s national effort to increase copper production to support the war effort in Korea. The operations included open pit mining, concentrating and leaching of copper ores. The mining and milling concluded in 1978 while leaching continued until 1982 when the site closed. Over the mine life according to USGS records, a total of 68.7 million tonnes of ore was milled at an estimated feed grade of approximately 0.66% with production of 895 million pounds of copper including 75 million pounds of copper cathode.

ABOUT CAPSTONE MINING CORP.

On November 30, 2021, Capstone Mining and Mantos Copper announced that they have entered into a definitive agreement to combine pursuant to a plan of arrangement under the Business Corporations Act (British Columbia). Upon completion of the Transaction, the new Company would be renamed Capstone Copper Corp. (Capstone Copper).

Capstone Mining Corp. is a Canadian base metals mining company, focused on copper. We are committed to the responsible development of our assets and the environments in which we operate. Our two producing mines are the Pinto Valley copper mine located in Arizona, US and the Cozamin copper-silver mine in Zacatecas State, Mexico. In addition, Capstone owns 100% of Santo Domingo, a large scale, fully permitted, copper-iron-gold project in Region III, Chile, as well as a portfolio of exploration properties. Capstone's strategy is to focus on the optimization of operations and assets in politically stable, mining-friendly regions, centred in the Americas. Our headquarters are in Vancouver, Canada and we are listed on the Toronto Stock Exchange (TSX) under the symbol CS.

https://www.businesswire.com/news/home/20220120005417/en/Capstone-Enters-Into-Exploration-Access-Agreement-With-BHP-Copper-Inc.-for-Copper-Cities-Project

Back to Top

Copper Mountain Announces Continued Positive Drill Results at New Ingerbelle, Extends Mineralization to the West

VANCOUVER, BC, Jan. 20, 2022 /CNW/ - Copper Mountain Mining Corporation (TSX: CMMC) (ASX:C6C) (the "Company" or "Copper Mountain") is pleased to announce positive results from an additional 10 diamond drill holes, totalling 4,178 metres, as part of the ongoing exploration program at the New Ingerbelle copper-gold open pit ("New Ingerbelle"). The drill program continues to intersect significant widths of high-grade mineralization below, and adjacent to, the current reserve pit. New Ingerbelle is situated one kilometre from the Copper Mountain Mine main pit. The Copper Mountain Mine is in southern British Columbia, near the town of Princeton.

The location of the 10 drill holes is shown on a map and a longitudinal section of the deposit in Figures 1 and 2. A complete drill hole summary is provided in Table 1. Figures 3 and 4 show the location of all drill holes in the current New Ingerbelle drill program.

"Drilling at New Ingerbelle continues to expand the size of the deposit" commented Gil Clausen, Copper Mountain's President and CEO. "The ongoing drill program has extended the New Ingerbelle mineralization at depth as well as along strike and the deposit remains open in a number of directions. Based on the positive drilling results from the current program, we expect to substantially increase the Mineral Reserve and Mineral Resource estimate at our Copper Mountain Mine. We plan on announcing an updated Mineral Reserve and Mineral Resource estimate, which will include all drill results from this ongoing drill program along with a new life of mine plan based on a mine/mill expansion by mid-2022. We believe this new plan will demonstrate the scale potential of the Copper Mountain Mine."

Drill Program

The ten drill holes are in the central and western parts of the deposit and have been successful to date in testing the extent and continuity of mineralization at depth and westward below an interpreted, ore-bounding thrust fault. Mineralization remains open below the thrust fault and further drilling will be required to determine the western extent of the deposit.

Mineralization at New Ingerbelle consists of disseminated and fracture-controlled sulphide mineralization and exhibits a strong continuity over hundreds of metres of vertical extent. Geology, alteration intensity and copper/gold ratios appear to be relatively consistent over the vertical extent of the mineralization.

The Company is continuing to drill at New Ingerbelle, with two diamond drills on site. The current program consists of approximately 27,000 metres of diamond drilling and is expected to be completed in the first quarter of 2022. The Company plans to incorporate the results of the 2021-2022 drill program into an updated Mineral Reserves and Mineral Resources estimate, which will in turn support a new "Life of Mine Plan" which is expected to be published in mid-2022.

New Ingerbelle is a past producing open pit that was discovered and developed in the late 1960s with mining taking place between 1972 and 1980. Copper Mountain started exploration drilling at New Ingerbelle in 2017. New Ingerbelle's current Mineral Reserve estimate as of January 1, 2021, is 191 million tonnes grading 0.24% Cu, 0.15 g/t Au and 0.48 g/t Ag, containing 1.0 billion lb Cu, 916k oz Au and 2.9 million oz Ag (as disclosed in Copper Mountain's Annual Information Form dated March 29, 2021, available on SEDAR).


Figure 1: Plan View (Drill Hole Location Map) (CNW Group/Copper Mountain Mining Corporation)
Figure 2 Longitudinal Section (CNW Group/Copper Mountain Mining Corporation)
Figure 3: Plan View of 2021-2022 Drill Program Holes (CNW Group/Copper Mountain Mining Corporation)
Notes:
1. Planned hole locations may change depending on results and operational constraints.


Figure 4: Longitudinal Section of 2021-2022 Drill Program Holes (CNW Group/Copper Mountain Mining Corporation)
Notes:
1. Planned hole locations may change depending on results and operational constraints.


Table 1: Drill Hole Table(1,2)

Hole ID
Azi
Dip
Length (m)
From (m)
To (m)
Interval (m)
Cu%
Ag g/t
Au g/t
Cu Eq %(3)
21IG-21
59.8
-56.5
635
54
170
116
0.30
0.55
0.24
0.44


Incl
54
96
42
0.30
0.52
0.32
0.49


Incl
104
142
38
0.37
0.72
0.23
0.50


Incl
142
170
28
0.26
0.45
0.17
0.36


194
221
27
0.19
0.28
0.08
0.23


239
332
93
0.21
0.46
0.12
0.28


Incl
239
281
42
0.17
0.36
0.07
0.21


Incl
290
332
42
0.28
0.63
0.21
0.40


356
365
9
0.17
0.36
0.12
0.24


374
431
57
0.23
0.46
0.19
0.34


461
551
90
0.21
0.42
0.14
0.29
21IG-22
262.0
-46.0
401
11
45
34
0.46
0.98
0.29
0.63


59
113
54
0.24
0.63
0.19
0.35


Incl
59
97
38
0.30
0.79
0.23
0.44


Incl
99
113
14
0.12
0.28
0.07
0.16


182
212
30
0.18
0.41
0.09
0.23


224
332
108
0.20
0.23
0.12
0.27


Incl
224
263
39
0.20
0.31
0.10
0.26


Incl
296
332
36
0.36
0.28
0.24
0.49


21IG-23
243.0
-57.0
446
18
41
23
0.43
0.78
0.27
0.59


104
152
48
0.28
0.51
0.16
0.37


215
248
33
0.54
0.70
0.33
0.73


353
425
72
0.40
0.41
0.20
0.51


21IG-24
301.0
-56.0
377
12
92
80
0.37
0.75
0.24
0.51


113
134
21
0.20
0.23
0.08
0.25


149
251
102
0.63
0.55
0.35
0.83


21IG-25
125.0
-77.0
705
38
90
52
0.36
0.68
0.21
0.48


100
106
6
0.54
1.05
0.26
0.70


116
134
18
0.15
0.24
0.07
0.19


155
170
15
0.27
0.58
0.17
0.36


203
272
69
0.29
0.55
0.19
0.40


Incl
203
215
12
0.22
0.51
0.14
0.30


Incl
224
272
48
0.35
0.64
0.23
0.48


296
527
231
0.31
0.46
0.12
0.38


Incl
296
482
186
0.35
0.53
0.13
0.43


Incl
488
497
9
0.19
0.14
0.06
0.22


Incl
509
527
18
0.13
0.21
0.06
0.17


557
572
15
0.20
0.25
0.06
0.24


617
665
48
0.15
0.17
0.05
0.18


21IG-26
58.0
-50.0
660
118
136
18
0.42
0.48
0.21
0.54


142
153
11
0.18
0.29
0.12
0.25


164
266
102
0.31
0.34
0.13
0.39


320
335
15
0.14
0.20
0.10
0.20


470
482
12
0.34
0.35
0.24
0.48


512
611
99
0.30
0.61
0.17
0.40


Incl
512
527
15
0.32
0.61
0.26
0.47


Incl
539
554
15
0.38
0.66
0.16
0.48


Incl
560
584
24
0.61
0.35
0.31
0.79


Incl
596
611
15
0.29
0.56
0.17
0.39


21IG-27
164
-51
374
177
215
38
0.38
0.71
0.25
0.53


245
260
15
0.53
0.97
0.22
0.67


293
335
42
0.22
0.92
0.14
0.30


0.00
21IG-28
303
-62
580
191
203
12
0.23
1.45
0.09
0.29


251
269
18
0.32
0.73
0.14
0.40


407
485
78
0.44
0.33
0.29
0.61
Notes:
1. Holes 21IG-19 and 21IG-20 were lost due to ground conditions.
2. Table shows detailed drill results of intercepts over 0.20% CuEq
3. CuEq calculated using long-term bank consensus metal prices (in US$) of 3.43, 1,601, 21.04 and recoveries of 85%, 71%, 65% for Cu, Au, and Ag, respectively.


https://finance.yahoo.com/news/copper-mountain-announces-continued-positive-120000383.html

Back to Top

Copper Fox Identifies Additional Porphyry Targets at Eaglehead

Calgary, Alberta--(Newsfile Corp. - January 20, 2022) - Copper Fox Metals Inc. (TSXV: CUU) (OTCQX: CPFXF)("Copper Fox" or the "Company") through its wholly owned subsidiary Northern Fox Copper Inc. is pleased to provide an update on the geophysical modelling on its 100% owned Eaglehead polymetallic porphyry copper project located approximately 50 kilometers ('km') east of Dease Lake, British Columbia. The Eaglehead project covers a large portion (15,956 ha) of the late Jurassic age, Eaglehead stock located at the southern margin of the Quesnel terrane. The Quesnel terrane hosts several porphyry copper deposits including Lorraine, Mt. Milligan, and Mount Polly to the south.

In preparation for a 2022 field season, compilation and re-interpretation of current and historical exploration data resulted in completion of a Magnetization Vector Inversion (MVI) analyses of the airborne magnetic and radiometric data collected in 2014. Magnetization Vector Inversion is an exploration technique used to locate magnetite bearing, high temperature hydrothermal centres indicative of potassic (K-spar-magnetite-secondary biotite) altered zones associated with porphyry systems.

Highlights

The MVI analyses identified five areas, interpreted to represent late-stage intrusive plugs with associated potassic (magnetite) alteration.

Four of the interpreted late-stage intrusive plugs exhibit a strong spatial correlation to the Thibert Fault system.

The four interpreted intrusives located along the Thibert Fault exhibit a strong positive correlation to known areas of copper mineralization and copper-molybdenum ('Cu-Mo') in soil geochemical anomalies.

The compilation indicates the main portion of the porphyry could be to the north and at depth below the near surface mineralized zones.

Elmer B. Stewart, President and CEO of Copper Fox, stated, "The MVI study has identified a 10km long linear trend with four late-stage intrusive plugs exhibiting the magnetic characteristics of a porphyry copper system. These late-stage intrusives are located at depth below the surface zones of mineralization distributed along or in proximity to the Thibert Fault and show a very strong correlation with all known areas of copper mineralization and Cu-Mo in soil geochemical anomalies. The MVI study also identified two previously unknown targets and identified priority areas in which to focus future exploration.

Geological Model

The historical drilling intersected six, open ended zones of near surface, intrusion hosted polymetallic porphyry style mineralization. Modelling (3D) of the mineralization in the Bornite and East zones and the three distinct, overlapping episodes of copper mineralization suggests that the drilling intersected the very upper level of an evolving porphyry system.

The MVI study, and trace element ratios (fertility indices) indicate late-stage, intrusive/hydrothermal activity at depth, the upper levels of which are represented by the near surface zones of porphyry mineralization. The spatial association of the copper mineralization and interpreted buried intrusives suggests the Thibert Fault exerted significant control on the emplacement of the late stage intrusives and porphyry mineralization. The model provides an explanation for the MVI study results, area/zones of mineralization and distribution of Cu-Mo in soil anomalies in relation to the intrusive plugs and structures. The data suggest that the main portion of the porphyry system could be to the north and at depth below the surface mineralization

https://stockhouse.com/news/press-releases/2022/01/20/copper-fox-identifies-additional-porphyry-targets-at-eaglehead

Back to Top

Coal

10 World’s Biggest Coal Producers

10 World’s Biggest Coal Producers-According to World Mining Data 2021, International Organizing Committee for The World Mining Congresses, there Top 10 world’s biggest coal producers in 2019. Because of the abundance of coal reserved in some countries, they can produce huge coal from their own land. Some countries with huge reserves of coal absolutely have the advantage to use it for domestic industries. Basically, some producers of coal with huge reserves also sales it to foreign countries to add their trading income.

Commonly, coal is solid organic fuel sediment formed from plants that have undergone biochemical and physical decay in oxygen-free conditions that take place at certain pressures and temperatures for an exceedingly extended period. Chemically, coal is composed of several elements i.e., carbon, hydrogen and nitrogen, and oxygen with classified into four types, namely anthracite, bituminous, subbituminous, and lignite. In the modern era, along with the development of technology.

Statistic of Steam Coal in 2019

Statistically, the production of coal is at stable levels. The world still needs coal. In the last 5 years, from 2015-2019, the production of steam coal showed an uptrend from 5,6 billion tons in 2015, 5,2 billion tons in 2016, 5,5 billion tons in 2017, 5,8 billion tons in 2018, and 5,9 billion tons in 2019. Based on the country regions, China, India, Indonesia, The United States of America, and Australia still become the biggest producers of steam coal.

Statistic of Coking Coal in 2019

the statistics production of coking coal in the mixed level with up and downtrend. 1,09 billion tons in 2015, 1,04 billion tons in 2016, 1,02 billion tons in 2017, 989 million tons in 2018, and 1,025 billion tons 2019. China, Australia, Russia, and The United States of America (USA) still become the biggest producers of coking coal / Metallurgical coal.

Steam coal Is usually used for electric power production because of its ability to burn quickly at elevated temperatures. Based on the countries, there are ten world’s biggest steam coal producers in 2019, these data were obtained from World Mining Data 2021. Here is the rank of 10 World’s Biggest of Steam Coal Producers.

The Rank of 10 World’s Biggest of Steam Coal Producers

Rank Countries Production of Steam Coal in 2019 (metric tons) 1 China 2,967,272,082 2 India 677,936,000 3 Indonesia 610,407,030 4 The United States of America 521,540,300 5 Australia 271,618,000 6 Russia 266,700,000 7 South Africa 249,665,481 8 Kazakhstan 98,593,000 9 Columbia 75,042,100 10 Poland 50,009,000 Source : World Data Mining, 2021

Meanwhile, choking coal, the coal that has low sulfur and phosphorus content, is used in the steel industries. Based on the coking coal producers in 2019, there are ten world’s biggest producers of coking coal. Here is the rank of 10 World’s Biggest Coking Coal Producers.

The Rank of 10 World’s Biggest of Coking Coal Producers

Rank Countries Production of Coking Coal in 2019 (metric tons) 1 China 502,544,830 2 Australia 188,251,000 3 Russia 93,900,000 4 The United States of America 64,168,100 5 India 52,937,000 6 Canada 33,921,000 7 Mongolia 30,516,900 8 Poland 12,071,000 9 Kazakhstan 10,478,500 10 Ukraine 5,783,200 Source : World Data Mining, 2021

Brief Descriptions of 10 World’s Coal Producers

1.China

China becomes the biggest of coal producers in 2019. Statistically, the total production of steam coal reaches 2,9 billion tons, and coking coal reaches 502 million tons. In this country, some coal mining areas are explored in Inner Mongolia, Shanxi, and Shaanxi provinces. The usage of coal production can be utilized in the electric power industry, metal industry, and some industries that need heating processes.

2.India

India is the next biggest producer of coal in 2019. Based on the World Mining Data 2021, the production of steam coal from this country reaches 677 million tons. It makes India the second-biggest producer of Steam Coal. Meanwhile, the production of coking coal reaches fifty-two million tons and makes India the fifth world is biggest of coking coal producers.

Geographically, there are some states in India with the biggest coal reserves. These states are Jharkhand, Odisha, Chhattisgarh, West Bengal, Madya Pradesh, Telangana, and Maharashtra. As one of the populous countries, India needs coal to generate electric power, Raw material for metal industries, and some coal has some functions on Cement and Fertilizer industries.

3.Indonesia

Indonesia is the next biggest producer of coal. The archipelago country can produce 610 million of steam coal and 1.6 million tons of coking coal. Geographically, there are some provinces in Indonesia that have the biggest production of coal. These provinces are Papua Barat (West Papua), Kalimantan Selatan (South Kalimantan), Sumatera Selatan (South Sumatera), Aceh, and Sumatera Barat (West Sumatera). The huge production of coal from Indonesia has benefits in electric power industries, fertilizer, and steel industries. Indonesia also exports coal to other countries, namely China, India, South Korea, and others.

4.The United States of America

The United States of America is the next one of the biggest producers of coal. In 2019, based on Mining Database in 2021, the production of steam coal from this country reaches 521 million tons and coking coal reach sixty-four million tons. This data showed that the United States become the fourth biggest producer of Steam coal and Coking Coal. Geographically, in the USA, there are primary areas of coal productions. Some of the states with the biggest production of Coal are Wyoming, West Virginia, Pennsylvania, Illinois, and North Dakota

5.Australia

Australia is the next biggest country of coal. In 2019, the production of kangaroo country reaches 271 million tons of steam coal and 188 million of coking coal. This data showed that Australia is the fifth biggest of steam coal and the second biggest of coking coal. Geographically, in this country, there are some states with the biggest production of coal (black and brown coal). These regions are New South Wales, Queensland, South Australia, Tasmania, Victoria, and Western Australia. More than 70% of coal is produced from open-cut mines. It happens because this mining process need less expenditure than underground mining.

6.Russia

Russia is the European country with the biggest coal production. In 2019, the production of Russia’s steam coal reached 266 million tons and ninety-three million tons of coking coal. It makes Russia as the fifth biggest of Steam Coal and the third biggest of coking coal. Geographically, in this Karl Max’s country, some coal mining areas in Russia are in Donets, Moscow, Pechora, Kuznetsk, Kansk-Achinsk, Irkutsk, and South Yakutsk basins. Most of the production of coal is used to fulfill domestic consumption.

7.South Africa

South Africa is the next biggest country in the African region with huge production of coal. In 2019, statistically, the production of steam coal from Nelson Mandela’s country reaches 249 million tons and coking coal of 3.9 million tons. Geographically, there are some provinces of South Africa that operate coal mining productions. Eastern Cape, Free State, Gauteng, Kwa-Zulu Natal, Limpopo, Mpumalanga, Northern Cape, Northwest, Western Cape are some of the coal mining areas.

8.Kazakhstan

Kazakhstan becomes one the biggest country of coal production from the Asia Region. Statistically, the production of steam Coal in 2019 reached ninety-eight million tons and coking coal reached 10.4 million tons. This statistical data can show that Kazakhstan is the eighth world’s biggest of steam coal and the ninth biggest of coking coal. Some coal mining areas are spread into Pavlodar and Karaganda cities. Specifically, there are some sites of the biggest coal production. These are Bogatyr Komir Mine, Vostochny Mine, Shubarkol Mine Severny Coal Mine, and Zhalyn Mine.

9.Columbia

Columbia has many deposits of coal. In this country, in 2019, the production of steam coal from Columbia reaches seventy-five million tons. El Cerrejon and la Loma mines are the two biggest areas of coal mining in Columbia.

10.Poland

Poland is the European country besides Russia that has the biggest production of coal. In 2019, the production of steam coal from this country reaches fifty million tons and coking coal reached 30.5 million tons. Its statistical data showed that Poland become the 10th biggest producer of steam coal and the eighth biggest producer of coking coal. In Poland, the coal mining is concentrated mostly in the Upper Silesia Basin, a few of them in Lower Silesia, and Lublin basins.

11. Canada

Canada is the sixth biggest producer of coking coal in 2019. Based on World Mining Data 2021, the production of Coking coal from Canada Reach 33.9 million tons. British Columbia, Alberta, Saskatchewan, and Novia Scotia are some provinces in Canada that has the biggest coal mines.

https://scienceagri.com/10-worlds-biggest-coal-producers/

Back to Top

Chinese Coal Output Surges.

Image

China’s coal production reached record levels last year as the state encouraged miners to ramp up their fossil fuel output to safeguard the country’s energy supplies through the winter gas crisis.

The world’s biggest coal producer and consumer mined 384.67m tonnes of the fossil fuel last month, easily topping its previous record of 370.84m tonnes set in November, after the government called for miners to work at maximum capacity to help fuel the country’s economic growth.

Official government figures show that China’s coal binge also spurred the country to record high coal output over the year as a whole. Chinese coal production climbed to an all-time high of 4.07bn tonnes, up 4.7% on the previous year, in a blow to climate campaigners months after the UN’s Cop26 climate talks in Glasgow.

The International Energy Agency (IEA) predicted that global consumption of coal power, which is the world’s single biggest source of climate emissions, would reach record levels in 2021driven by a surge in demand for energy to kickstart global economies following the coronavirus pandemic.

Coal power fell by 4% in 2020 as the pandemic caused a global economic slowdown, but the IEA found that the surge in demand for electricity during 2021 outpaced the growth in low-carbon sources, leading many wealthy economies to rely more heavily on fossil fuel power plants.

The IEA’s most recent report, published last week, found the steepest ever increase in global electricity demand last year was stoked by a 9% increase in coal use compared with the year before, or more than half of the global increase in power demand, to reach an all-time peak.

Back to Top

Steel, Iron Ore and Coal

Cleveland-Cliffs Inc. (NYSE:CLF) Receives Average Rating of "Buy" from Brokerages

Shares of Cleveland-Cliffs Inc. (NYSE:CLF) have been given an average recommendation of "Buy" by the fourteen ratings firms that are currently covering the company, MarketBeat Ratings reports. Four investment analysts have rated the stock with a hold rating, eight have assigned a buy rating and one has issued a strong buy rating on the company. The average twelve-month price objective among brokers that have issued a report on the stock in the last year is $26.17.

CLF has been the topic of several analyst reports. Morgan Stanley upped their target price on shares of Cleveland-Cliffs from $22.50 to $23.50 and gave the stock an "equal weight" rating in a report on Monday, November 29th. B. Riley upped their target price on shares of Cleveland-Cliffs from $36.00 to $37.00 and gave the stock a "buy" rating in a report on Monday, October 25th. Wolfe Research lowered shares of Cleveland-Cliffs from an "outperform" rating to a "peer perform" rating and set a $23.00 target price on the stock. in a report on Tuesday, January 11th. Zacks Investment Research raised shares of Cleveland-Cliffs from a "hold" rating to a "strong-buy" rating and set a $25.00 target price on the stock in a report on Tuesday, January 4th. Finally, The Goldman Sachs Group raised shares of Cleveland-Cliffs from a "neutral" rating to a "buy" rating and lowered their target price for the stock from $26.00 to $24.00 in a report on Wednesday, October 6th.

https://www.marketbeat.com/instant-alerts/nyse-clf-consensus-analyst-rating-2022-01-2/

Back to Top

Anglo American (OTCMKTS:NGLOY) Upgraded to "Strong-Buy" at Zacks Investment Research

Anglo American (OTCMKTS:NGLOY) was upgraded by Zacks Investment Research from a "hold" rating to a "strong-buy" rating in a research note issued on Friday, Zacks.com reports. The firm presently has a $26.00 price target on the mining company's stock. Zacks Investment Research's price target points to a potential upside of 13.51% from the company's previous close.

According to Zacks, "Anglo American PLC is a mining company. Its portfolio includes iron ore, manganese, metallurgical coal, copper, nickel, platinum and diamonds. The company operates primarily in Africa, Europe, North and South America, Asia and Australia. Anglo American PLC is headquartered in London, the United Kingdom. "

NGLOY has been the topic of a number of other research reports. UBS Group lowered Anglo American from a "neutral" rating to a "sell" rating in a research report on Friday, September 17th. Royal Bank of Canada raised Anglo American from a "sector perform" rating to an "outperform" rating in a research report on Tuesday, September 28th. They noted that the move was a valuation call. Barclays lowered Anglo American from an "overweight" rating to an "equal weight" rating in a report on Monday, September 20th. Morgan Stanley reissued an "equal weight" rating on shares of Anglo American in a report on Monday, October 25th. Finally, Liberum Capital raised Anglo American from a "hold" rating to a "buy" rating in a report on Wednesday, November 3rd. One equities research analyst has rated the stock with a sell rating, three have assigned a hold rating, six have given a buy rating and one has issued a strong buy rating to the company. Based on data from MarketBeat.com, Anglo American presently has a consensus rating of "Buy" and a consensus price target of $1,863.00.

https://www.marketbeat.com/instant-alerts/otcmkts-ngloy-a-buy-or-sell-right-now-2022-01-2/

Back to Top

Diary: Big Week for the Big Australian: 10% of ASX.

A big week for the ASX and BHP that will in one fell swoop lift the importance of the company to the ASX and performance of every major fund manager- especially those that track the ASX 200 and the mining and materials sectors.

If shareholders this week approve BHP’s delisting from London and the consolidation of its primary listing on the ASX (as they will) – returning to the situation that existed before the Billiton takeover two decades ago – BHP’s weighting in the benchmark ASX200 index will rise to around 10% from about 6.2% for the BHP Ltd Australian listing at the moment.

The meetings are due to be held this Thursday, January 20, a day after the company releases its second quarter and December half year production and sales report.

That report will be vital to valuations of BHP which will become more closely watched given its greater dominance of the ASX 200.

The change will cause considerable disruption for a short while as fund managers rebalance their BHP holdings, a situation that has seen index manager S&P Global concede the change would create “material” turbulence on the ASX.

The change will leave BHP with a market value of more than $220 billion after unification, well ahead of the Commonwealth Bank on $175 billion and CSL on $135 billion.

Unification will see many big investors switch their holdings from the old PLC company listed in London, to the Australian listed company and for others to top up their holdings – all with a single day’s trading.

Some local investors – Pendal and Ausbil for example – oppose the deal which will see BHP Plc shareholders receive one BHP Ltd share for every one held, effectively ignoring the discount for London-listed shares have traded at.

At least 75% of BHP’s Australian listed shares will have to be voted in favour of the deal.

UniSuper, a big industry fund, will vote in favour as will long time Melbourne based supporter, Australian Foundation Investment Co, as well as another investor, K2 Asset Management.

Proxy groups ISS Governance and CGI Glass Lewis have recommended their clients vote in favour, meaning the unification (which will cost an estimated $A675 million, according to BHP) will get up on Thursday.

As well, investors will be watching for comments from the company in the report about the outlook for 2022 which is being clouded by the impact of Omicron and an early year surge in iron ore prices because of heavy rain and flooding in Brazil.

Iron ore prices have jumped to more than $US133 a tonne for 62% Fe fines from the Pilbara, from $US120.75 at the end of December thanks to continuing rain and flooding that has shut much of the iron roe mining in the southern state of Minas Gerais (where the 2015 and 2019 dam wall collapses occurred in similar conditions).

The 2015 Samarco collapse is a problem still bedevilling BHP, which owned half the operation with Brazilian miner Vale (which saw an even bigger disaster in January 2019 that forced the company to slash production and sales and eventually contributed to the surge in global prices to record levels last May, helped by strong buying from Chinese steel mills that was abruptly ended by a government crackdown and the slide in Chinese property and construction activity).

The crackdown was driven by attempts to control pollution and carbon emissions ahead of the Glasgow climate change conference in November, rising complaints about smog and then power rationing which in turn added further pressure to Chinese steel production.

That saw the price of 62% Fe fines bottom out at just over $US87 a tonne last November and pries have gradually risen despite more production curbs in China, new outbreaks of Covid delta and omicron as well as the slide in construction and property which is showing no signs of easing.

That 50% rebound in price has happened without the same complaints there was from the Chinese government in April through October at firstly the sharp jump in iron prices and then thermal coal prices which more than doubled to $US300 a tonne and then halved after government intervention.

https://www.sharecafe.com.au/2022/01/16/diary-big-week-for-the-big-australian/

Back to Top

EU extends minimum price for electrical steel imports

BRUSSELS, Jan 17 (Reuters) - The European Union has extended for five years minimum prices for electrical steel from China, Japan, Russia, South Korea and the United States on the basis that producers would otherwise dump it on the EU market.

The bloc set three minimum prices for grades of grain-oriented flat-rolled products of silicon-electrical steel (GOES), which is used in power transformers, in October 2015 after a complaint by EU steelmakers association Eurofer.

The European Commission, which carried out the investigation, said that producers in the five countries had spare capacity and were likely to dump it in the European Union if the measures were dropped.

The Commission set minimum prices of between 1,536 euros and 2,043 euros per tonne.

If producers sell below these prices then they face duties ranging from 21.5% to 39%. Producers include China's Baoshan Iron and Steel Co and Wuhan Iron & Steel Co, Japan's JFE Steel Corp and Nippon Steel, Korea's POSCO, Russia's Novolipetsk Steel and AK Steel of the United States.

EU producers include ThyssenKrupp and Poland's Stalprodukt.

https://finance.yahoo.com/news/eu-extends-minimum-price-electrical-095515297.html

Back to Top

Iron ore sags on easing supply concerns, China downturn

Benchmark Dalian and Singapore iron ore futures fell on Monday, dragged down by improving near-term supply of the steelmaking ingredient and signs of continuing economic weakness in top steel producer China.

The drop came despite a surprise easing of monetary policy by the Chinese central bank and also weighed on other Dalian steelmaking inputs and steel futures in Shanghai.

Iron ore's most-traded iron ore May contract on China's Dalian Commodity Exchange dropped as much as 3.1% to 700 yuan a tonne, its lowest since Jan. 10.

On the Singapore Exchange, iron ore's most-active February contract shed 2.8% to $123.10 a tonne, its weakest since Jan. 5.

Iron ore sees solid first week of 2022 on China demand hopes

China's central bank cut the borrowing costs of its medium-term loans for the first time since April 2020, suggesting an intensifying economic slowdown, even as the world's second-biggest economy grew by a faster-than-expected 4% on annual terms in the last quarter of 2021.

"The lagged economic data and PBOC rate cut were already priced in, in our opinion," said Atilla Widnell, managing director at Navigate Commodities in Singapore.

China's economic growth in the previous quarter, however, was its weakest pace in one-and-a-half years, and the weakness will likely continue this quarter amid ongoing COVID-19 restrictions, some analysts said.

China's zero-tolerance policy for COVID-19 outbreaks and steel production curbs that are expected to continue until after next month's Winter Olympics in Beijing will likely keep demand for iron ore and other steel inputs depressed for some time.

Iron ore was due for a correction following recent rallies, Widnell said, adding the improving weather in key supplier Brazil and increased shipments from Australia could release some air from "overinflated" prices.

Spot iron ore for delivery to China scaled a three-month peak of $132.50 a tonne on Jan. 13, before slightly easing to $130 on Friday, SteelHome consultancy data showed.

Construction steel rebar and hot-rolled coil on the Shanghai Futures Exchange both lost 2.4% by midday break. Stainless steel slipped 0.1%.

Dalian coking coal slumped 3.8% and coke tumbled 5.2%.

https://www.brecorder.com/news/40147719

Back to Top

Higher & higher: Which companies can supply the green steel of the future with high grade iron ore?

High grade iron ore will be an essential ingredient in the only form of green steelmaking currently anywhere near commercial viability – direct reduced iron.

DRI plants already exist on a moderate scale around the world. They currently run off natural gas, and produce around a fifth of the CO2 emissions of the blast furnace process, which requires metallurgical coal as a reducing agent and currently produces around 2.2t of CO2 for every tonne of steel.

The theory is hydrogen could replace the gas in DRI plants, either in new plants or by retrofitting old ones.

The most advanced green steel research project in the world is using hydrogen in a DRI style process — Sweden’s Hybrit Consortium has already produced steel for delivery to Volvo and could be commercial by 2026.

But DRI has limitations in terms of the iron ore it can consume.

“DRI you don’t produce a slag in the furnace so the impurities you start with are the impurities you end with in the final product,” Fastmarkets MB senior price development manager Peter Hannah said.

“So there’s an imperative to really keep the grade, the raw material grade, super high and the impurities very low.

“They’re very constrained on the raw materials they can use and it’s just high grade, whereas blast furnaces will tend to consume a blend of … around about 62 or 63% Fe and they’ll just kind of play around that.”

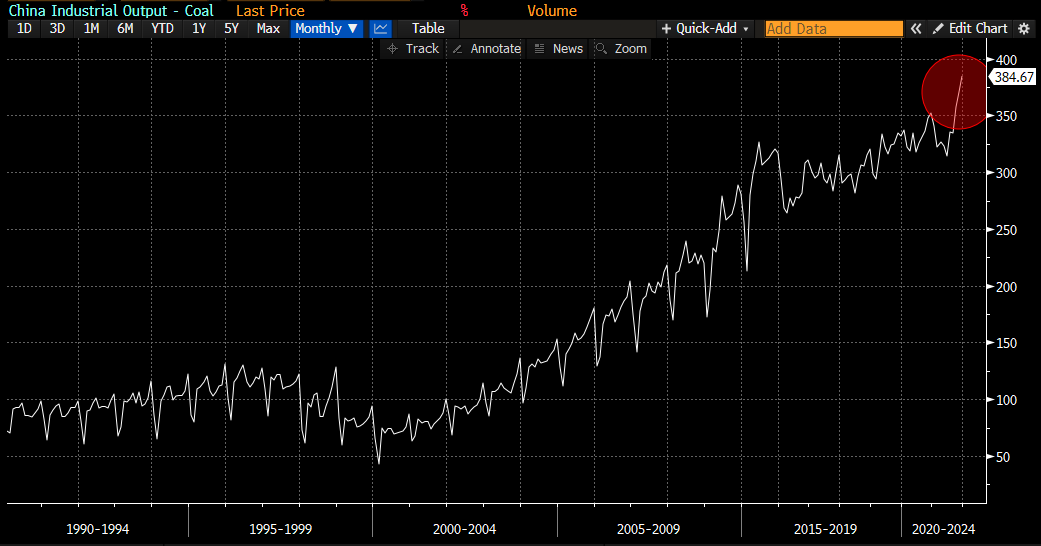
Low grade ores garner demand from the current blast furnace process that dominated the steel industry in China, the world’s largest steel market with around 60% of global production.

There they are blended with high grade fines to approximate a 62% iron ore product with a mix of impurities best suited to the mill in question.

But discounts for low grade ores are rising, and experts are unsure if the conditions that supported the growth of that segment of the market over the past two decades (think Fortescue, MinRes and Roy Hill) will reemerge again as green investment becomes the norm.

Price realisation for lower grades slide

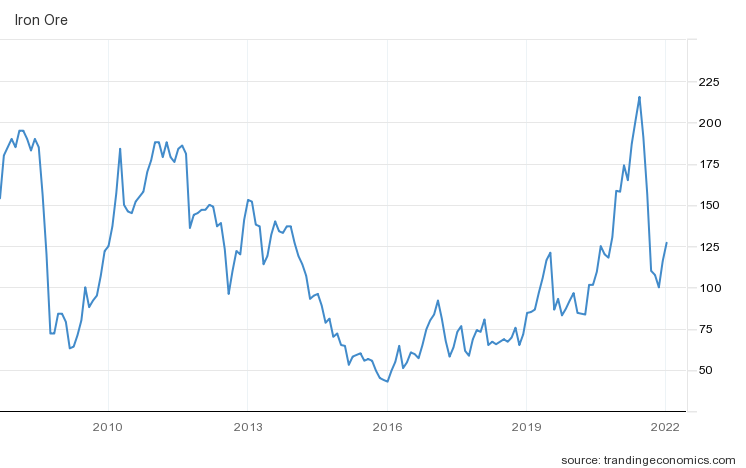
Price spreads for lower grade iron ore first became a big story in 2017 and 2018, when China’s efforts to curb pollution from steel mills led to big discounts for 58% iron ore.

They peaked at a 46% discount, which in that market threatened to make producers like FMG unprofitable and led to the temporary closure of Cleveland Cliffs’ Koolyanobbing mine in WA before it was salvaged when the State Government brokered its sale to MinRes.

That situation unwound quickly, with the price gap getting as low as 11% in late 2020 as super high iron ore prices made sub-grade products more palatable for steel mills.

But they are back up around the 40% mark, and experts like Hannah say they don’t think the conditions which created a boom market for low grade iron ore a decade ago will emerge again.

Unlike before, environmental management and specifically reducing CO2 emissions has emerged as China’s primary policy objective, with the country planning to hit peak emissions by 2025 and become a Net Zero state by 2060.

Higher grade iron ores produce less slag and require less coke for processing into crude steel, meaning coal consumption and resulting emissions are lower.

Flight to quality

Lower grade iron ore fines do receive demand as a blending product with higher grade 65% fines. Currently a mix of premium 65% fines and discounted 58% fines enables many mills to blend a 62% product cheaper than the prevailing 62% fines price.

Some miners have been happy to propose large scale lower grade developments with the aim that the greater economies of scale will have costs so low that the discount will be worth it.

But there is a clear flight to quality happening across the majors.

BHP (ASX:BHP) has just opened its US$3.6 billion 80Mtpa South Flank mine as a replacement for the Yandicoogina project. South Flank mainly produces lump, a premium ore that does not need sintering to process.

It will make BHP the largest producer of lump in the world, with about one-third of its Pilbara output being exported in that form.

Rio Tinto plans to make an investment decision this year on the development of its share of the Simandou development, one of the highest grade DSO orebodies in the world situated in troubled Guinea in Africa.

Fortescue Metals Group (ASX:FMG) has weathered a series of setbacks at its Iron Bridge magnetite development, but despite blowouts in its schedule and cost to ~US$3.5 billion (US$900m more than initially planned), the lure of producing 22Mtpa of 67-68% magnetite concentrate that would garner super premium prices has seen it stay the course.

That said, most Australian tonnes are coming at lower and lower grades as the good hematite ore in the Pilbara becomes harder to find. These resources have proven difficult to convert to higher grades as well.

While there are a handful of very high grade hematite direct shipping ores around, notably in Brazil and Africa, most high grade producers process and upgrade magnetite iron ore.

This material is lower grade in situ, but unlike standard Pilbara ores can be upgraded to a super rich 66% product or above, the kind that gets ultra high premiums from steel factories.

If the steel industry can go completely green by 2050 – at a cost of around US$278b – BloombergNEF says Australia risks losing its standing as the clear number one player to countries with higher grade iron ore reserves like Brazil and Russia.

High grade iron ore is hard to find — less than 30% of all iron ore produced is at the premium standard 65% plus — but a group of Australian explorers, miners and developers with an eye to iron ore’s high grade, green future have emerged in recent years.

There are too many to list them all here, and many companies have both high and low grade projects on their books. Here are some of the ASX-listed companies looking to capture the tailwinds for high grade iron ore.

Champion Iron is the largest high grade specialist on the ASX, producing 7.5Mtpa of 66.2% and 67.5% plus DRI quality iron ore concentrate from its Bloom Lake complex in Quebec, Canada.

Its origin story was an incredible counter-cyclical move from Champion and its Australian figurehead Michael O’Keefe, renowned for being part of the Riversdale Mining team that made a motsa selling the ill-fated Mozambique coal assets to Rio Tinto.

Champion bought Bloom Lake, which runs off renewable hydroelectric power, for just $10.5 million off Cliffs in 2016 at the height of the mining bust when iron ore prices were in the toilet.

It is now a $3.2 billion company, up around 3000% in the six years since signing off on the Bloom Lake deal.

The company says its 66.2% concentrate reduces emissions in the blast furnace steelmaking process, while its >67.5% pellet feed concentrate can be used in electric arc furnaces which normally require scrap steel as a feed source, 50% less emissions intense than blast furnaces.

Champion Iron has built on its success to fund an expansion of Bloom Lake to 15Mtpa, due to be complete by mid-2022, and is conducting research on producing a 69% super premium pellet iron ore product. The company has growth options as well at projects along the Labrador Trough.

Champion Iron share price today:

A clear leader in the listed Australian high grade space, Grange owns the Savage River mine in Tasmania from where iron ore has been produced for more than 55 years.

Largely owned by Chinese investors, Grange is small in stature but big in profitability, recording a $205.9m profit in the 2020-21 financial year, up 207% from the $67m profit it generated in FY20.

The premium offered for Grange’s pellets when prices are flying is beyond ridiculous.

In the June quarter of 2021, when iron ore reach its zenith, Grange ore was selling for US$287.15/t, generating a margin of almost AUD$300 on every tonne of iron ore shipped. It helped Grange pay two healthy dividends in 2021, first a 2c a share dividend on its annual results then a 10c a share Xmas special, liquidating some of the $554.6m in cash sitting in its bank account after a bumper 2021.

Grange is looking at going harder for longer at Savage River, completing a PFS in December that showed it could up “green pellet production” threefold from ~2Mtpa to ~6Mtpa over 10 years by switching from open pit to underground caving methods.

A DFS and board decision are due in the first half of 2022. Grange has a second growth option at the 5Mtpa Southdown magnetite project near Albany in WA’s Great Southern region, where a PFS is being undertaken.

A decade-old study placed a prohibitive US$2.9 billion price tag on a larger 10Mtpa Southdown development.

Grange Resources share price today:

Mount Gibson Iron was one of the low grade iron ore miners caught short when the iron ore price nosedived and freight rates skyrocketed last year, sending its newly opened Shine operation near Geraldton into mothballs.

But the high grades at its Koolan Island operation provided motivation to keep going with a pre-strip to open a new orebody at the mine in WA’s north.

Koolan Island is a rarity in Australian iron ore, a hematite DSO mine which produces a 65% product.

It was the site of one of BHP’s original iron ore operations, producing 68 million tonnes of hematite grading 67% between 1963 and its initial closure in 1994.

The mine closed in 2014 when a seawall that shielded it from the oceans in the surrounding Buccaneer Archipelago failed, prompting a massive insurance claim Mount Gibson used to dewater the mine and recommence shipments as iron ore prices rose in 2019.

Mount Gibson has around five years left at Koolan after completing a pre-strip last year and upgrading its crusher, and expects to ramp up to ship 1.7Mt from the mine this financial year after selling just 400,000t through the first half of FY2022.

Mount Gibson Iron share price today:

Few companies on this list are as wedded to the narrative around high grade iron ore and green steel making as Magnetite Mines.

Technical director Mark Eames, an iron ore executive whose career has included stints at BHP, Rio, Glencore and X-Strata, even wrote a company white paper last year about the industry’s transformation.

A pre-feasibility study on its Razorback iron ore mine in South Australia last year placed a price tag of up to $675 million for its go forward case, involving the production of 3Mtpa of 68% iron ore concentrate a year over a 23-year mine life.

That capex estimate is three times less than the number produced by the previous management of the company.

One of those costs savings could be a potential ESG boon for the junior iron ore hopeful, which wants to leverage the work the South Australian Government has done to shift most of its grid electricity supply to wind power.

By connecting to the grid through a transmission line MGT expects to save considerable money it would otherwise have spent on a standalone power plant and capture an ESG premium by using renewable energy to power its processing operations.

Magnetite, which is up 280% over the past year, is set to complete a DFS before the end of 2022 aiming at a production start date of 2024.

Magnetite Mines share price today:

Strike’s proposed Paulsens East mine in the Pilbara is relatively standard fare for a WA iron ore junior, boasting a 9.6Mt resource at a decent grade of 61.1% iron and a 1.5Mtpa run rate consisting of a 75-25 split of 62% lump and 59% fines.

This project could be a nice cash generator at current iron ore prices, shipping 1.5-2Mtpa at a start-up cost of just $5m and cash costs of US$63-69/t.

But Strike’s big high grade gambit is in Peru at its Apurimac operations, where it has already begun exporting small quantities of ~65% DSO product at a rate of up to 125,000tpa, making its first shipment in August last year.

The larger magnetite resource contains 269Mt of iron ore at 57.3%, which according to studies dating back to 2010, could produce ~20Mtpa of 66% concentrate at a build cost of US$2.6-2.9b and opex of US$17-20/t.

Given the age of that study Strike, which last year spun out its lithium and graphite assets into float Lithium Energy (ASX:LEL), is preparing a new PFS on the larger Apurimac project.

One area where it expects to make a saving is via the construction of the US$4.6 billion, 577km long Andahuaylas Railway by the Peruvian Government which would connect the mine to port, with construction expected to start as soon as next year.

Strike Resources share price today:

Fenix Resources’ small Iron Ridge mine in the Mid West is a modest orebody but has one of the highest grades of any hematite iron ore project in WA.

Built at a cost of just $12 million, Iron Ridge has an ore reserve of 7.76Mt at 63.9% Fe. Built in just four months in late 2020, the mine is expected to produce 1.25Mtpa over a 6.5-year life.

It was expected to make $16.4m in annual EBITDA, but caught iron ore’s record run to US$230/t perfectly in May, generating revenues of $65.3m and a net profit of $49m after tax on just 500,000t of lump and fines sales.

An innovative hedging strategy helped Fenix generate a profit margin of $64 on each of its first million tonnes sold, with the big question now being what will MD Rob Brierley do with his war chest, which already funded a $24.5m, 5.25c a share maiden dividend in September.

Fenix is yet to diversify into the high grade magnetite iron ore projects of many of its peers in the Mid West and Yilgarn iron ore district like Juno Minerals (ASX:JNO), Macarthur Minerals (ASX:MIO) and a host of other small companies operating in inland WA.

CuFe Limited’s (ASX:CUF) 60% owned JWD project (GWR Group holds the balance) near Wiluna is another example of a company with a relatively high grade DSO project but no long term plan to produce DRI quality high grade ore.

Its JWD ore, sold under an offtake deal with Glencore, generates a high-grade lump premium – currently around US$30/t over benchmark 62% fines prices – and comes from a resource of 10.7 Mt at 63.7% Fe, 2.8% SiO2 and 1.5% Al2O3.

Mid West and Yilgarn miners share prices today:

Pearl Gull Iron (ASX:PLG) completed a $4 million listing at 20c last September on the same day the iron ore price fell below US$100/t for the first time in a year.

It was inopportune timing for the new junior, which owns leases on Cockatoo Island.

Located near Koolan Island in the Kimberley, Cockatoo Island was the site of BHP’s first iron ore mine in WA and boasted a similar grade.

Pearl Gull does not hold the rights to the original Cockatoo Island orebody, the subject of the Pluton Resources collapse a few years ago.

But it has had some success in drilling at its Switch Pit target adjacent to the historic Seawall Pit mine.

The first drilling by Pearl Gull at the Switch Pit starting in July last year included an intersection of 44.7m at 69.5%, described by director Jonathan Fisher as “some of the highest grade iron ore results I have ever seen”.

Unfortunately Pearl Gull has been unable to keep up the momentum despite releasing more drill results in December and is down over 60% since its listing to 7.5c a share.

Pearl Gull Iron share price today

Formerly known as Carpentaria Resources, Hawsons owns the deposit of the same name near the historic mining town of Broken Hill in New South Wales, birthplace of BHP.

Hawsons boasts a maiden probable reserve 755Mt at 14.7% Davis Tube Recovery grade it says could be upgraded to 111Mt of “Supergrade” 70% magnetite concentrate, which it is marketing as a “green steel” product.

A PFS was released in 2017 estimating it would cost US$1.4 billion to deliver a project shipping 10Mtpa at an all-in FOB cost of US$48.03/dmt.

Hawsons, which has seen its shares climb 380% over the past year, was able to nestle away $35.6 million from investors last year to fund a bankable feasibility study.

Hawsons Iron share price today

Iron Road owns the Central Eyre Iron Project near Warramboo in South Australia.

Recently it has been one of the proponents of a new “green” export facility at Cape Hardy in region SA, but news about the project underpinning those plans has been relatively scant.

An “optimisation” study back in 2015 placed a US$4.6 billion overall cost (including a $570m pre-strip) on developing a 24Mtpa mine producing a 67% concentrate with low impurities, a capital investment even BHP and Rio would struggle to find the money for at that sort of production rate.

In 2017 that was cut to $US3.7b and then US$1.74 billion in 2019 by reducing its targeted production rate to 12Mtpa, replacing rail with road trains and a reduction in power requirements.

South Australia has a rich history of magnetite iron ore production, with Whyalla Steelworks owner GFG Alliance running the Simec Mining Middleback Ranges mine site around 60km from the steel town.

Most of the 1.3Mtpa of high grade pellets is supplied to the Whyalla Steelworks with around 10Mtpa of hematite ore shipped to Asian customers.

Iron Road share price today

Another ASX-listed but overseas focused stock, Magnum Mining and Exploration owns the Buena Vista Iron Ore project in Nevada over in the USA.

Magnum’s plan is to go beyond just mining iron ore to selling “green” hot briquetted iron and pig iron products to customers in the States and Asia.

It is currently trialling a method using biochar rather than coal or coke in the steel production process.

The company has had an agreement to negotiate on offtake with Anglo American in place since mid-2021, but late last year extended the time to complete the deal to November 30, 2022, amid the changing scope of the Buena Vista project from a magnetite concentrate mine to a “green iron” development.

Magnum Mining share price today

At Stockhead, we tell it like it is. While Magnetite Mines, Strike Resources and CuFe Ltd are a Stockhead advertisers, they did not sponsor this article.

https://stockhead.com.au/resources/higher-higher-which-companies-can-supply-the-green-steel-of-the-future-with-high-grade-iron-ore/

Back to Top

Shanghai steel futures range-bound amid supply disruption, sluggish demand

Around 50 steelmakers have announced maintenance plans near the coming Lunar New Year holidays, with some producers planning to resume production in late-February or March, according to consultancy Mysteel.

BEIJING — Chinese steel rebar and hot rolled coils futures traded within a tight range on Tuesday as consumption by the construction sector remains weak, with mills cutting production ahead of holidays.

The most-active construction rebar on the Shanghai Futures Exchange for May delivery dipped 0.7% to 4,557 yuan ($718.42) per tonne as of 0215 GMT.

Hot rolled coils futures, used in the manufacturing sector, slipped 0.7% to 4,663 yuan a tonne.

There is limited room for further decline in steel prices supported by easing monetary policy that aims to stabilize the economy, GF Futures analysts said.

Stainless steel prices on the Shanghai bourse for February delivery jumped 2% to 18,025 yuan per tonne.

Benchmark iron ore futures on the Dalian Commodity Exchange were down 1.6% at 697 yuan a tonne, falling below 700 yuan for the first time since Jan. 10.

Spot prices of iron ore with 62% iron content for delivery to China fell $2.5 to $127.5 on Monday, data from consultancy SteelHome showed.

Other steelmaking ingredients on the Dalian exchange were mixed, with coking coal increasing 0.5% to 2,239 yuan a tonne, while coke prices dropped 1.5% to 2,944 yuan per tonne.

($1 = 6.3431 Chinese yuan) (Reporting by Min Zhang in Beijing and Enrico Dela Cruz in Manila; Editing by Shounak Dasgupta)

https://financialpost.com/pmn/business-pmn/shanghai-steel-futures-range-bound-amid-supply-disruption-sluggish-demand

Back to Top

Shanghai steel futures range-bound amid supply worries, sluggish demand

Chinese steel rebar and hot rolled coils futures traded within a tight range on Tuesday as consumption by the construction sector remained weak, with mills cutting production ahead of holidays.

Around 50 steelmakers have announced maintenance plans near the coming Lunar New Year holidays, with some producers planning to resume production in late-February or March, according to consultancy Mysteel.

However, a still sluggish real estate market offset the impact from reduced supply. China’s gross domestic product in the property sector fell 2.9% in the fourth quarter of 2021 compared with same period a year earlier, data from the National Bureau of Statistics here showed.

The most-active construction rebar on the Shanghai Futures Exchange for May delivery inched up 0.3% to 4,599 yuan ($724.45) per tonne at close.

Hot rolled coils futures, used in the manufacturing sector, edged 0.3% higher to 4,709 yuan a tonne.

There is limited room for further decline in steel prices supported by easing monetary policy that aims to stabilise the economy, GF Futures analysts said.

Stainless steel prices on the Shanghai bourse for February delivery jumped 1.7% to 17,970 yuan per tonne.

Benchmark iron ore futures on the Dalian Commodity Exchange ended up 1.1% at 715 yuan a tonne, recovering from losses in early session.

Spot prices of iron ore with 62% iron content for delivery to China SH-CCN-IRNOR62 fell $2.5 to $127.5 on Monday, data from consultancy SteelHome showed.

Brazilian miner Vale SA is resuming production after heavy rains and said its annual iron ore production guidance remained at 320-335 million tonnes.

Meanwhile, Rio Tinto expects its 2022 iron ore shipments from the Pilbara region at 320-335 million tonnes, slightly weaker than expected due to labour market conditions.

Dalian coking coal rose 3.7% to 2,312 yuan a tonne, tracking thermal coal futures on the Zhengzhou Commodity Exchange which surged as much as 6.8% in afternoon session.

Coke prices on the Dalian exchange increased 0.1% to 2,993 yuan per tonne.

Source: Reuters (Reporting by Min Zhang in Beijing and Enrico Dela Cruz in Manila; Editing by Shounak Dasgupta)

https://www.hellenicshippingnews.com/shanghai-steel-futures-range-bound-amid-supply-worries-sluggish-demand/

Back to Top

Rio Tinto: Asymmetric Global Growth Opportunity (NYSE:RIO)

Rio Tinto: Asymmetric Global Growth Opportunity

Jan. 19, 2022 7:56 AM ETRio Tinto Group (RIO), RTNTF, RTPPFAA, AMSYF, FCX, MT, TRQ, VALE20 Comments28 Likes

Summary

  • Rio Tinto has quietly staged an upside breakout from a 10-year consolidation pattern that followed the global financial crisis.
  • Sales growth of 75% through the first half of 2021 was led by a powerful bull market in industrial metals as global demand stressed available supply.
  • Global supply and demand conditions point toward excess demand over the coming decade as the energy transition is extraordinarily metals-intensive.
  • Rio Tinto’s Copper EBITDA grew 200% through the first half of 2021, while the company has peer-leading copper production growth potential of 90%.
  • Aluminum EBITDA grew 108% on a 32% sales improvement highlighting Rio Tinto’s industry leading efficiency. Structural market shifts open the door to sustained higher prices.
Train loading iron ore, Pilbara, Australia


I am assigning Rio Tinto Group (NYSE:RIO) a positive risk/reward rating based on its leverage to Asian economic growth, its peer-leading copper growth potential, a robust outlook for the global aluminum market, and its asymmetric risk/reward profile. The downside is supported by a 10-year technical base and a discounted valuation, while the upside is bolstered by a structurally bullish supply and demand balance for industrial metals.

Risk/Reward Rating: Positive

Rio Tinto is among the world’s leading producers of iron ore and aluminum and offers one of the highest copper growth profiles amongst its peers. As a result, the investment case for Rio Tinto hinges on the global supply of and demand for these critical industrial commodities, as well as Rio Tinto’s competitive positioning.

The following two tables provide an overview of Rio Tinto’s business by commodity and were compiled from Rio Tinto’s October 2021 Investor Seminar and Annual Report 2020, respectively. The first table provides an overview of the company’s sales and profitability by commodity segment through the first half of 2021. The second table provides a more granular look at the sales performance by commodity over the prior three years.

RIO 1H 2021 Performance

Source: Created by Brian Kapp, stoxdox

RIO Sales by Product

Source: Created by Brian Kapp, stoxdox

I have highlighted in blue the iron ore business as it has been a standout in recent years. It is the primary driver of Rio Tinto’s performance at 63% of sales and 75% of EBITDA through the first half of 2021. Sales growth from 2018 through 2020 was very strong at 47%. Annualizing the first half 2021 performance, sales growth is on pace to reach an incredible 118% compared to 2018.

Rio Tinto’s iron ore operations are centered in the Pilbara region of Australia and are arguably one of the highest quality and lowest cost iron ore assets in the world. This is reflected in EBITDA growth outpacing sales growth through the first half of 2021, coming in at 109% compared to sales growth of 89% in the face of cost pressures and global supply chain disruptions.

Between 2018 and 2020, sales in the aluminum and copper businesses contracted by 24% and 25%, respectively. I have highlighted these segments in yellow in the above tables. Notice that these metals put in a bottom in 2020 and are staging a powerful rebound in 2021. Copper EBITDA is up an incredible 200% through the first half of 2021 compared to 2020 on a 91% sales increase. The aluminum sales rebound was substantial at 32% while EBITDA exploded by 108%. These two metals will be key growth drivers for Rio Tinto over the coming decade.

Iron Ore

Rio Tinto’s incredible overall performance was driven by a powerful bull market in the price of iron ore. Iron ore increased 125% from the end of 2018 through the end of 2020. At the absolute peak in July 2021, iron ore was briefly up 213% compared to the end of 2018. The following chart from tradingeconomics.com provides a visual overview of iron ore prices over the past decade.

iron ore prices

Source: tradingeconomics.com

Iron ore was in a brutal bear market from 2011 through 2015 with prices down 79% from peak to trough. The period from 2016 through 2018 was defined by a stabilization in the market before the new bull market began in 2019. The primary driver of the new bull market has been Chinese steel production which can be seen in the following chart from tradingeconomics.com.

Chinese steel production

Source: tradingeconomics.com / World Steel Association

Steel production in China stagnated from 2013 through 2017 before breaking out to the upside in 2018. The powerful effect of Chinese demand on iron ore prices is self-evident and presents both the greatest opportunity and greatest risk for Rio Tinto. Notice that Chinese steel production turned materially lower after peaking in the middle of 2021.

The spike in the price of iron ore to an all-time high near $216 per ton created an economic disincentive for steel production. By some estimates, every $10 spike in the price of iron ore costs Chinese steel producers an additional $10 billion as China imports 80% of its iron ore demand. Another factor at play in the short term is China’s desire to reduce emissions and improve air quality for the upcoming 2022 Winter Olympics in Beijing.

Levered to Asian Demand

Rio Tinto offers one of the highest exposures to Chinese and Asian industrial demand in the equity market. The following table was compiled from Rio Tinto’s Annual Report 2020 and provides an overview of sales by region. Sales to the Asia Pacific market (highlighted in yellow) account for 76% of total revenue. The Asia Pacific region is the manufacturing center of the world and thus offers the highest growth potential for iron ore and industrial commodities generally.

RIO Geographic

Source: Created by Brian Kapp, stoxdox

Given China’s 58% share of Rio Tinto’s revenue and its competitive positioning at the core of the world’s industrial supply chain, the greatest risk facing the Rio Tinto investment case is Chinese trade tensions. The following passage from Rio Tinto’s Annual Report 2020 summarizes the situation well (emphasis added):

Tensions between the United States and China have become more structurally ingrained… Still, the economies of the United States and China remain closely intertwined and, despite growing talks of decoupling, this new era of competition will be shaped as much by how and where both countries agree to co-operate.

China’s competitive advantage is its ability to execute industrial projects at scale in a condensed time frame. This ability enables higher global economic growth than would otherwise be possible via increased productivity. China’s industrial capabilities are likely to remain advantageous for all members of the global economy. As a result, it is reasonable to expect China to continue to be the leading industrial producer going forward, which bodes well for Rio Tinto.

China’s Belt and Road Initiative or BRI best encapsulates Rio Tinto’s growth opportunity in Asia as well as the geopolitical tensions. The following excerpt from a January 2020 Council on Foreign Relations article, “China’s Massive Belt and Road Initiative” by Andrew Chatzky and James McBride, highlights the growth opportunity (emphasis added).

China’s Belt and Road Initiative sometimes referred to as the New Silk Road, is one of the most ambitious infrastructure projects ever conceived… (The Asian Development Bank estimated that the region faces a yearly infrastructure financing shortfall of nearly $800 billion.)… To date, more than sixty countries—accounting for two-thirds of the world’s population—have signed on to projects or indicated an interest in doing so.

Western governments are rightfully concerned about China’s rapidly expanding geopolitical influence. That said, the economic reality is that China is the only country capable of executing on the industrial production requirements of the world at scale. The differences between China and the West lie in the financing and geopolitical aspects of the Belt and Road concept rather than in whether or not it should or will happen.

Global Growth Opportunity

As a result, the coming global infrastructure boom and energy transition are highly likely to feature China at the core of global industrial production. The following table from Citi Research’s Copper Book: 2021-2030 Outlook highlights the growth opportunity for industrial metals resulting from the global energy transition.

Citi Research’s Copper Book: 2021-2030 Outlook

Source: Citi Research, IPCC, BNEF

While the Citi Research report focuses on the incredible growth opportunity for copper, it also highlights the larger opportunity for Rio Tinto emanating from incremental steel (iron ore) and aluminum demand as a result of global decarbonization. The most important columns are the final two on the right.

Steel (iron ore) is projected to make up 69% of the incremental total metal tonnage demand from global decarbonization policies. This may appear unusual at first glance; however, green energy technologies are surprisingly steel-intensive. The following quote from ArcelorMittal’s website offers a glimpse into this reality. ArcelorMittal (NYSE:MT) is the world’s second largest steel producer.

Steel will play an important role in all renewables, including and especially solar and wind. Each new MW of solar power requires between 35 to 45 tons of steel, and each new MW of wind power requires 120 to 180 tons of steel.

Steel is slated to comprise 23% of the incremental metal value created by decarbonization plans. The average annual incremental steel value is estimated to be $110 billion. Rio Tinto’s second and third largest business lines are aluminum and copper which account for 14% and 28% of the estimated incremental value creation from decarbonization demand. The average annual incremental aluminum and copper value opportunity is forecasted to be $67 billion and $133 billion, respectively.

Please keep in mind that these estimates are for incremental demand from decarbonization between 2020 and 2050. This is in addition to baseline demand which closely tracks global GDP growth. Prior to the 2021 iron ore price spike to all-time highs, Rio Tinto’s annual sales averaged $42 billion between 2017 and 2020. The additional $300 billion plus of annual revenue opportunity for Rio Tinto’s key industrial metals is an extraordinary growth opportunity. Also note that this is prior to accounting for material growth opportunities in other metals such a lithium. For example, Rio Tinto is on track to become the largest lithium producer in Europe with first production slated for 2026 from its high-quality Jadar project in Serbia.

The Commodities

The growth outlook for Rio Tinto’s primary commodities is robust given the incremental demand from the global infrastructure buildout and energy transition. These metals comprise the majority of the investment case for Rio Tinto and will be viewed separately below in building the investment case. To set the stage, the following table summarizes key commodity prices since 2018. It was compiled from Rio Tinto’s Annual Report 2020 and Half Year Results 2021 as well as publicly available metal prices. Please note that dmt stands for dry metric ton.

RIO Historical Prices

Source: Created by Brian Kapp, stoxdox

Iron Ore: Core Business

Through the middle of 2021, the iron ore business was running at an annualized EBITDA rate of $32 billion compared to a current enterprise value of $123 billion. If this performance were sustainable, Rio Tinto would be trading at a deep discount to fair value. The average iron ore price in the first half of 2021 was $168 per ton compared to the current price of $126 per ton.

In reviewing Rio Tinto’s sustainable iron ore business, I have chosen to exclude the incredible performance in 2021 resulting from the spike in iron ore prices discussed previously. This approach is appropriate in light of the iron ore market returning to a more balanced supply and demand situation after the COVID supply disruptions.

Consensus iron ore price forecasts through 2025 reflect expectations for the market to stabilize at the upper end of the trading range between 2016 and 2020. The following table is from “Iron ore price rally is over, prices to follow multi-year downtrend — report” on mining.com, and displays the consensus iron ore price estimate for each year as well as Fitch estimates (which are more bearish).

“Iron ore price rally is over, prices to follow multi-year downtrend — report”

Source: mining.com

I have highlighted in yellow what I believe to be the best forecast for iron ore prices through 2025 using consensus analyst estimates supplied by Bloomberg. The Fitch forecast is included to emphasize the potential downside risks and the generally subdued outlook for iron ore prices.

The central forecast tendency toward the mid-$80 range through 2025 looks like an appropriate baseline expectation going forward. Given that this forward price estimate is at the top end of the trading range between 2016 and 2020, it is likely to be a strong support zone for iron ore prices. As a result, Rio Tinto’s iron ore performance in recent years offers a high confidence estimate of sustainable iron ore earnings. The following table was compiled from Rio Tinto’s Annual Report 2020 and details its iron ore earnings between 2018 and 2020.

RIO Iron Ore

Source: Created by Brian Kapp, stoxdox

I have highlighted in yellow Rio Tinto’s 2019 iron ore earnings and the average iron ore price for 2019. The $9.6 billion of iron ore earnings in 2019 at an average iron ore price of $85 is an excellent sustainable earnings estimate given the iron ore price forecast. Using the consensus estimates as a baseline price for iron ore allows for upside surprises emanating from the global energy transition and the various Belt and Road initiatives.

https://seekingalpha.com/article/4480290-rio-tinto-stock-asymmetric-global-growth-opportunity

Back to Top

Company Incorporated in England and Wales, Partnership number OC344951 Registered address: Commodity Intelligence LLP The Wellsprings Wellsprings Brightwell-Cum-Sotwell Oxford OX10 0RN.

Commodity Intelligence LLP is Authorised and Regulated by the Financial Conduct Authority.

The material is based on information that we consider reliable, but we do not guarantee that it is accurate or complete, and it should not be relied on as such. Opinions expressed are our current opinions as of the date appearing on this material only.

Officers and employees, including persons involved in the preparation or issuance of this material may from time to time have 'long' or 'short' positions in the securities of companies mentioned herein. No part of this material may be redistributed without the prior written consent of Commodity Intelligence LLP.

© 2025 - Commodity Intelligence LLP